Ninety days in, the roadmap flatlined
The thesis was clean enough to fit on one slide: buy a steady B2B logistics platform, fund the sales motion, ship the dormant roadmap, exit at a multiple of where it sat. The diligence binder was thick. Net revenue retention held. Customer calls were glowing. Then, roughly ninety days after close, the asset stopped producing.
The Q1 feature list slipped to Q3. A routing bug that should have been a one-hour fix sat open for nine days because nobody trusted the module enough to touch it. The new VP of Sales — hired specifically to sell the roadmap — was demoing features that did not exist yet and improvising the dates. When the Operating Partner finally cornered the founder-CTO, he got the sentence every PE deal team dreads: "The code is spaghetti. We need to rewrite it."
Nobody underwrote a rewrite. The model assumed a growth engine you could feed. What the fund actually owned was a liability that never made it onto the quality-of-earnings: deferred architecture, fragile releases, and rework that compounds every sprint. McKinsey puts the weight of this at 20–40% of the value of the entire technology estate before depreciation — and on this platform it was not abstract. The team was burning roughly seventeen hours a week, north of 40% of capacity, keeping the old transaction engine upright instead of extending it. The interest on the debt had quietly eaten the entire build budget, which is why the roadmap had no fuel left.
Why we said no to the rewrite — and what we did instead
We killed the 12-month rewrite request in the first week. A rewrite asks the same team that produced the tangle to reproduce every undocumented business rule — every carrier exception, every weird shipping zone, every workaround a customer now depends on — while the platform goes dark to new features. In a hold period measured in months, going dark is the same as losing the year. So we ran a 120-day paydown that left the lights on the whole time, the kind of disciplined approach to inheriting and fixing the debt without halting operations.
Days 1–30: stop guessing, start measuring
We replaced opinions with static analysis. The module handling 80% of shipment transactions showed a change-failure rate of 45% — touch it twice, break it once. That number, not the founder's frustration, became the case. We sorted every debt item into three buckets and threw two of them out: existential debt (security and stability — fix now), growth-blocking debt (the specific code standing between the team and the Q3 roadmap — scheduled paydown), and cosmetic debt (ugly but stable — left alone on purpose). Most "we have to rewrite everything" panic dissolves the moment you separate the code that is actually costing you money from the code that is merely offensive to read.
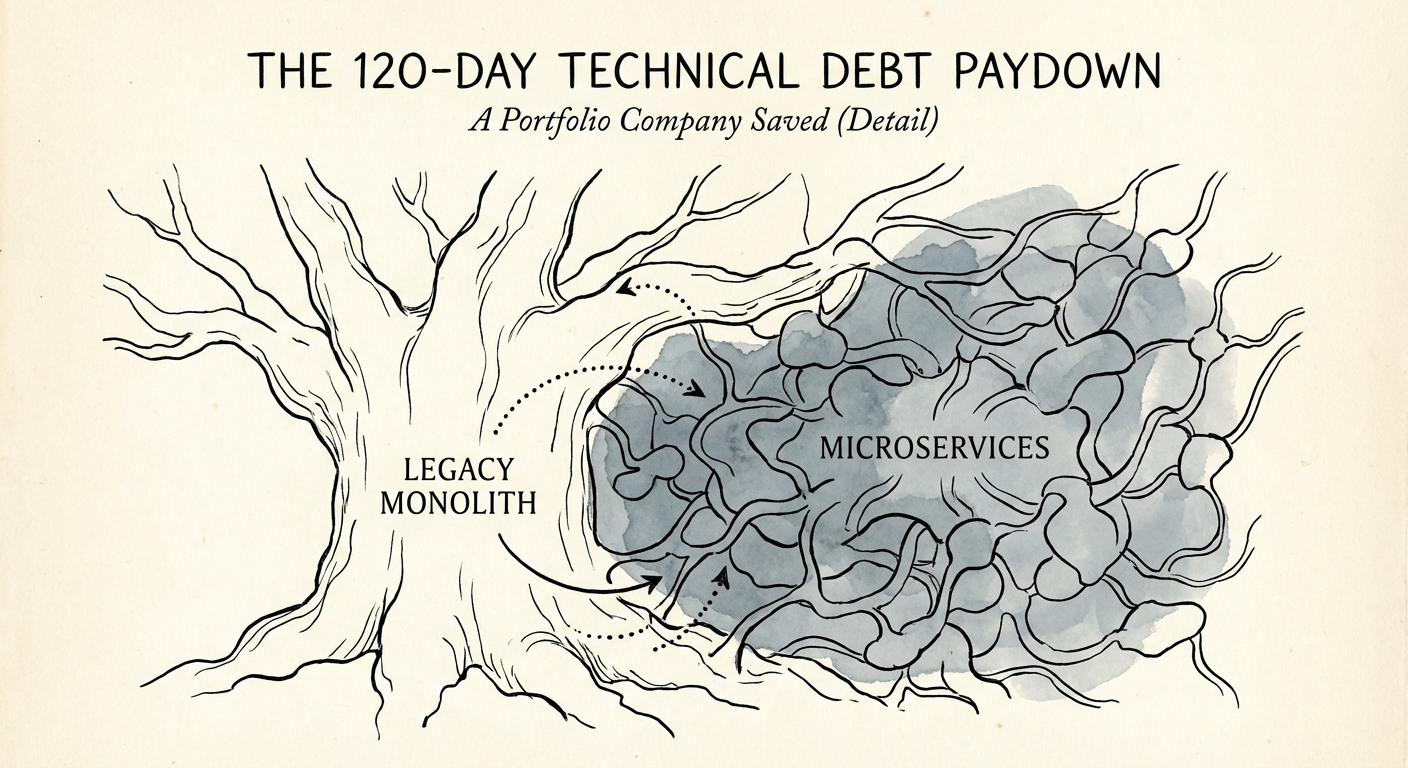
Days 31–90: strangle the core, don't gut it
We applied the Strangler Fig pattern to the transaction engine. New microservices stood up beside the legacy monolith and quietly absorbed all new API traffic — first rate quoting, then label generation, then tracking webhooks — while the old core kept serving what it already served. Each route we moved was a feature shipped in a clean environment and a piece of the daily fire drill switched off. Stripe's Developer Coefficient found that bad code can swallow nearly 42% of a developer's week; we were buying that time back one carrier integration at a time, not in one terrifying cutover.
Days 91–120: make speed permanent
With the fires contained, we rebuilt the deployment pipeline so the gains couldn't quietly erode. Mean time to recovery dropped from four days to four hours. Automated test coverage became a merge gate — coverage the founder had "temporarily" suspended years earlier to hit a sales date and never restored. We tracked deployment frequency and change-failure rate weekly, the kind of DevOps metrics that move the P&L, because in a portfolio company unmeasured engineering improvement is indistinguishable from busywork.
What 120 days bought, in dollars and in dates
By day 120 the win was arithmetic, not vibes. Engineering capacity rose about 33% — no new hires, just the recovered tax on rework. Hitting that same throughput by headcount would have meant roughly $2.4M in annualized salary the model never planned for. The Q3 roadmap shipped on schedule. The rewrite the CTO swore was unavoidable never happened, and the platform held steady enough to actually carry the growth thesis the fund paid for.
The transferable lesson for an operating partner is narrow and worth keeping: in a software-enabled asset, change-failure rate and recovery time are leading indicators of whether the roadmap is real, and the time to read them is in diligence — not ninety days after wire. CISQ pegs the cost of poor software quality in the U.S. at $2.41 trillion a year; some non-trivial slice of that is sitting inside assets that looked fundable on paper and froze on contact with a roadmap. The fix is to quantify technical debt in diligence as rigorously as you audit working capital.
What to do before you wire the funds
- Run the scan, not the interview. "It works" from a founder-CTO is a feeling. A change-failure rate on the revenue-critical module is a number you can underwrite.
- Budget to strangle, not to rewrite. Price an incremental paydown that ships features the whole time. A clean-slate rewrite is a year of dark plus the risk it ships late.
- Put the engineering metric next to the P&L line. Reclaimed capacity is headcount you didn't buy; a falling failure rate is a roadmap that ships. That is the language the deal committee already speaks.