COMMERCIAL PERFORMANCE
Revenue Architecture
Customer profile, deal-desk, sales-engineering ratios, MEDDPICC, deal-stage definitions. Move win rates from 29% to 68%.
Open topicMARKET INTELLIGENCE
Operator-grade analysis on technology middle-market M&A, turnaround, founder extraction, revenue architecture, technical debt, and post-close integration. Updated weekly.

FEATURED
The most recent essays from the workshop. Written for operators, sponsors, and boards in the middle of a thesis test.
BRIEF · 6 min
A delivery consultant asks your AI how a feature works. It answers from last year's release notes. Here's how services firms version-control product docs before they ship retrieval.
BRIEF · 6 min
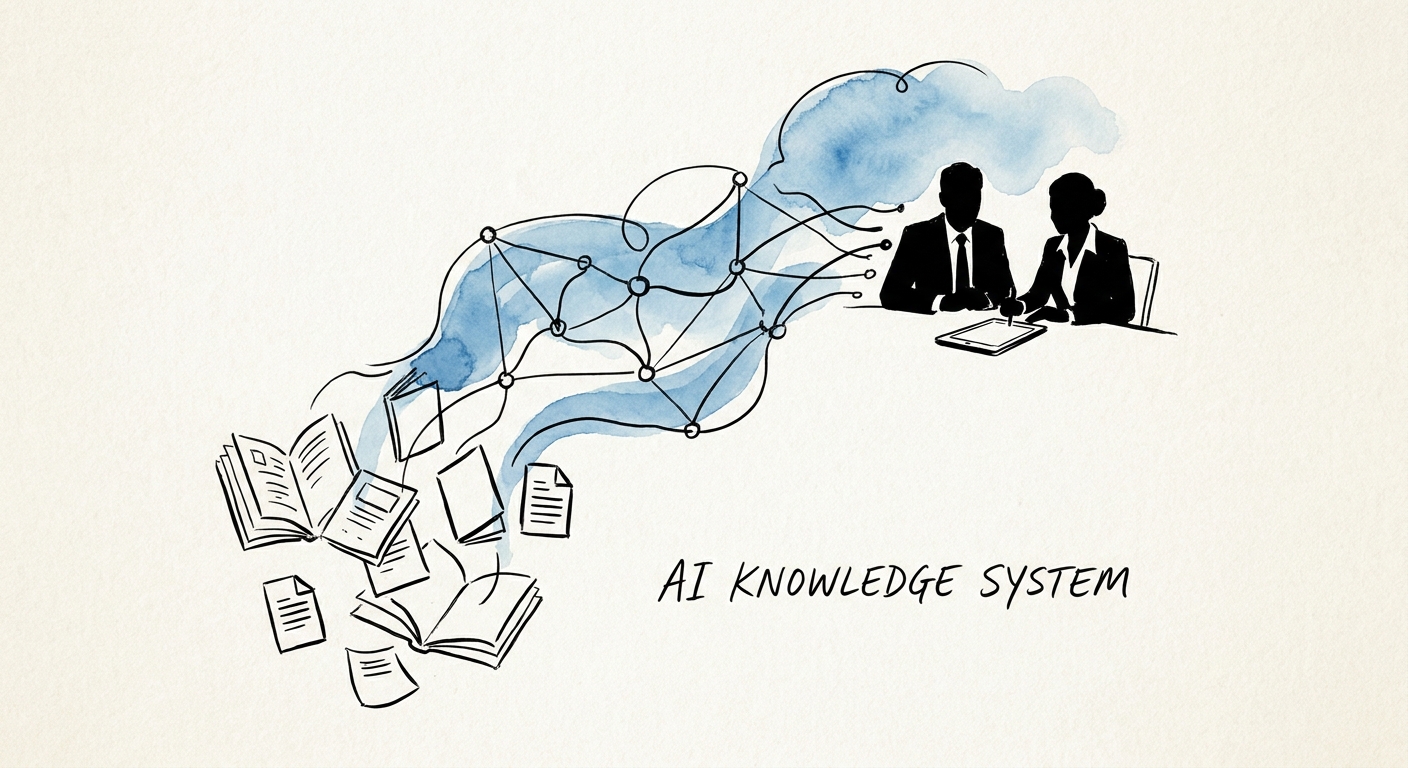
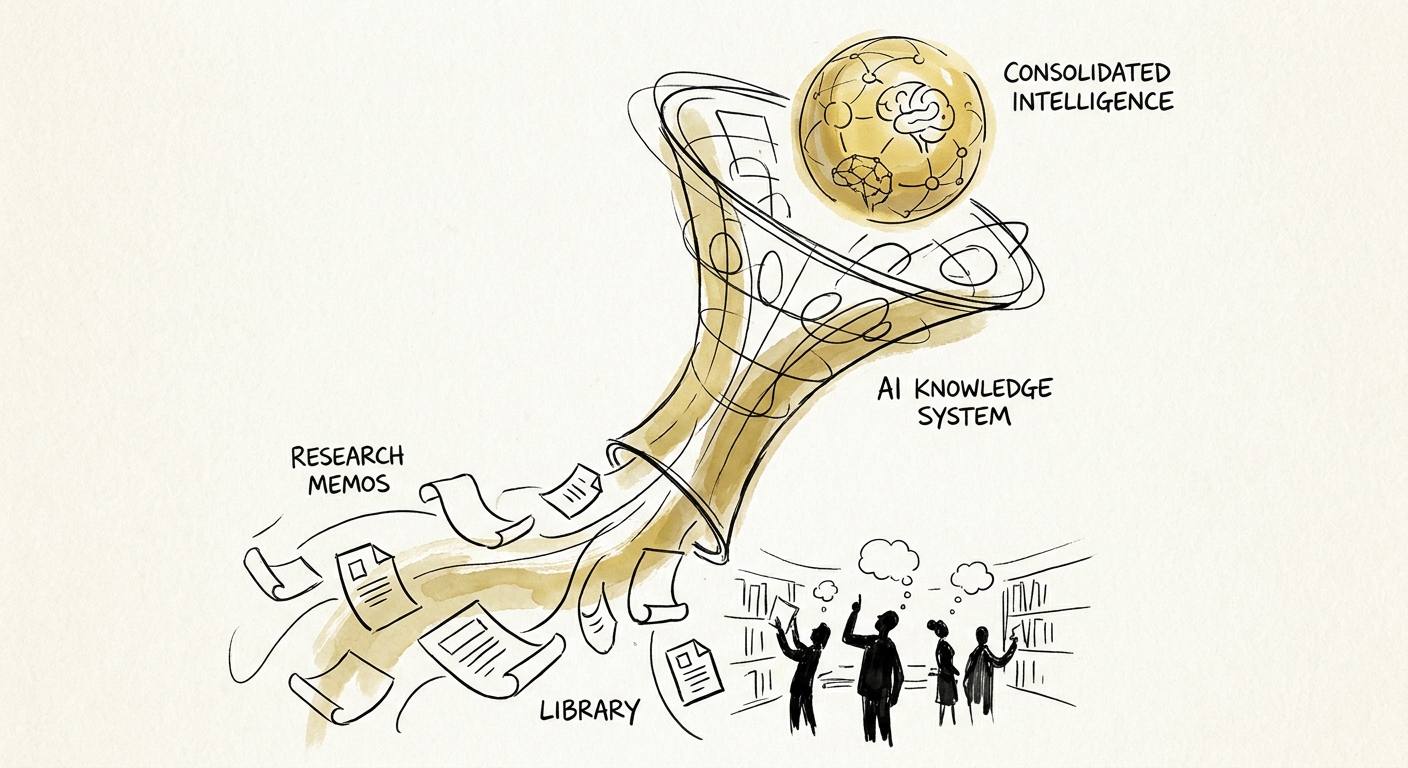
A research memo library is full of drafts, retired versions, and client-confidential findings. Here is how consulting firms build an AI system that knows the difference.
BRIEF · 6 min
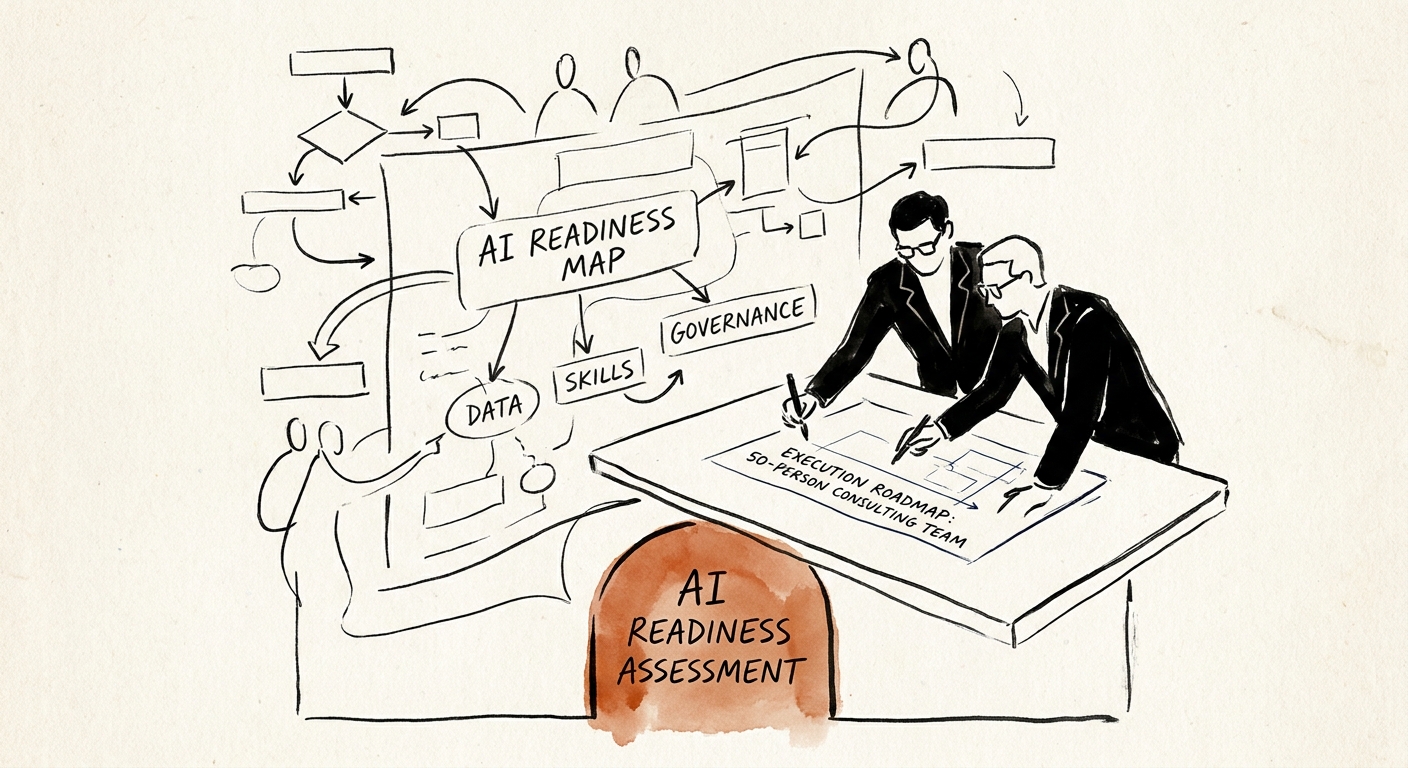
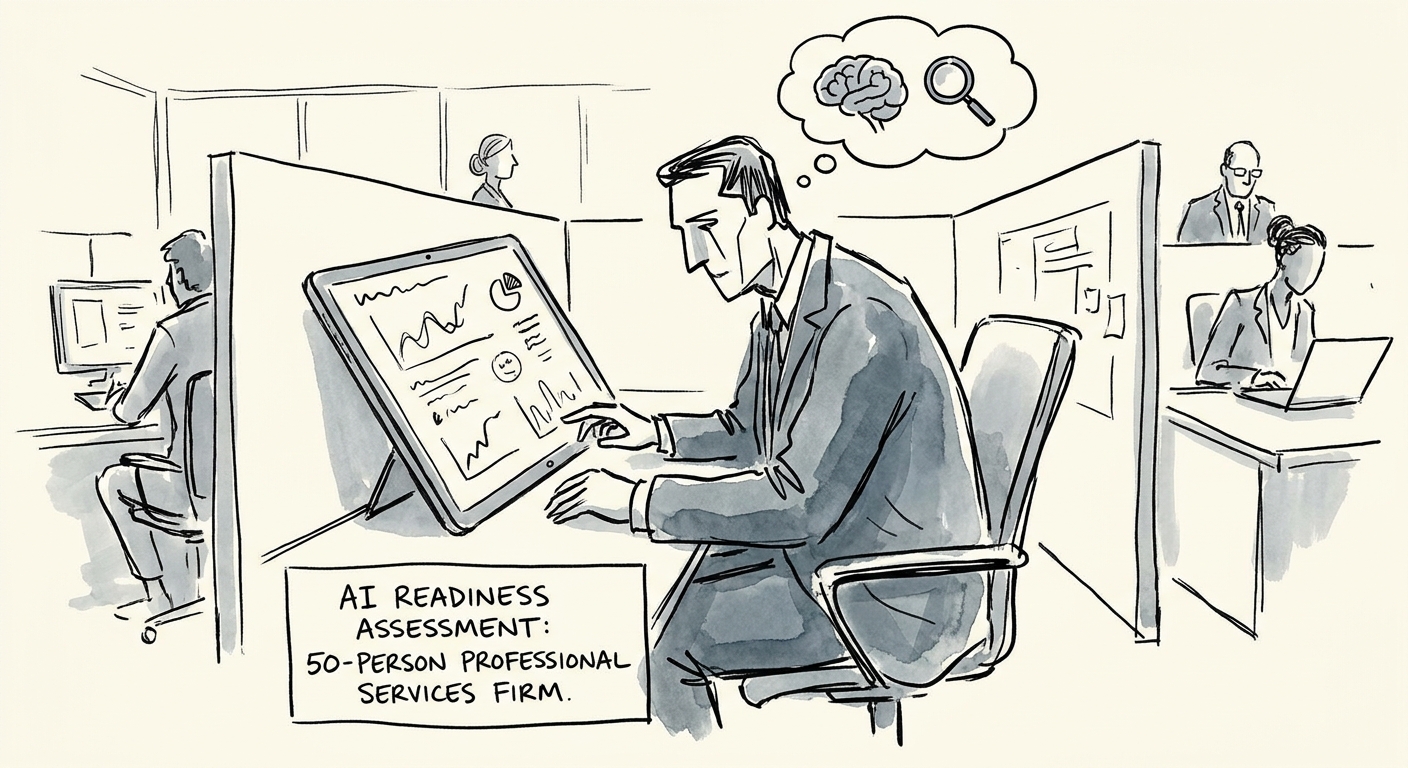
A 50-person consulting firm doesn't need an AI rollout. It needs one delivery workflow where realization, reuse, and partner review can be measured.
LATEST
The newest twelve reads on technology middle-market operating issues.
BRIEF · 6 min
A delivery consultant asks your AI how a feature works. It answers from last year's release notes. Here's how services firms version-control product docs before they ship retrieval.
BRIEF · 6 min
A research memo library is full of drafts, retired versions, and client-confidential findings. Here is how consulting firms build an AI system that knows the difference.
BRIEF · 6 min
A 50-person consulting firm doesn't need an AI rollout. It needs one delivery workflow where realization, reuse, and partner review can be measured.
BRIEF · 6 min
Most 50-person firms ask if they can buy an AI tool. The real readiness test is whether one billable workflow survives partner review. Here's how to check.
BRIEF · 6 min
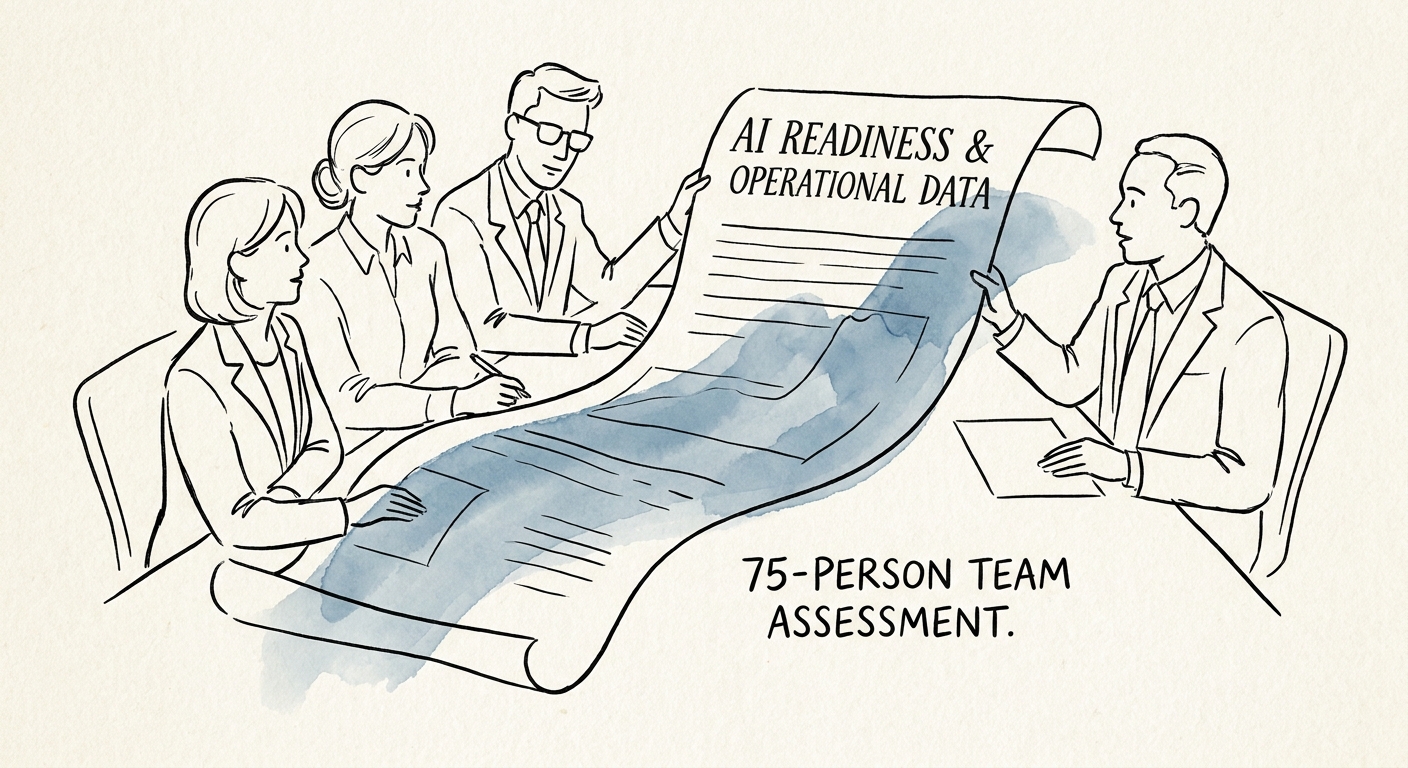
At 75 people, AI either lifts billable leverage or buries partners in review. Here's how to test which one before you roll a tool into client delivery.
BRIEF · 6 min
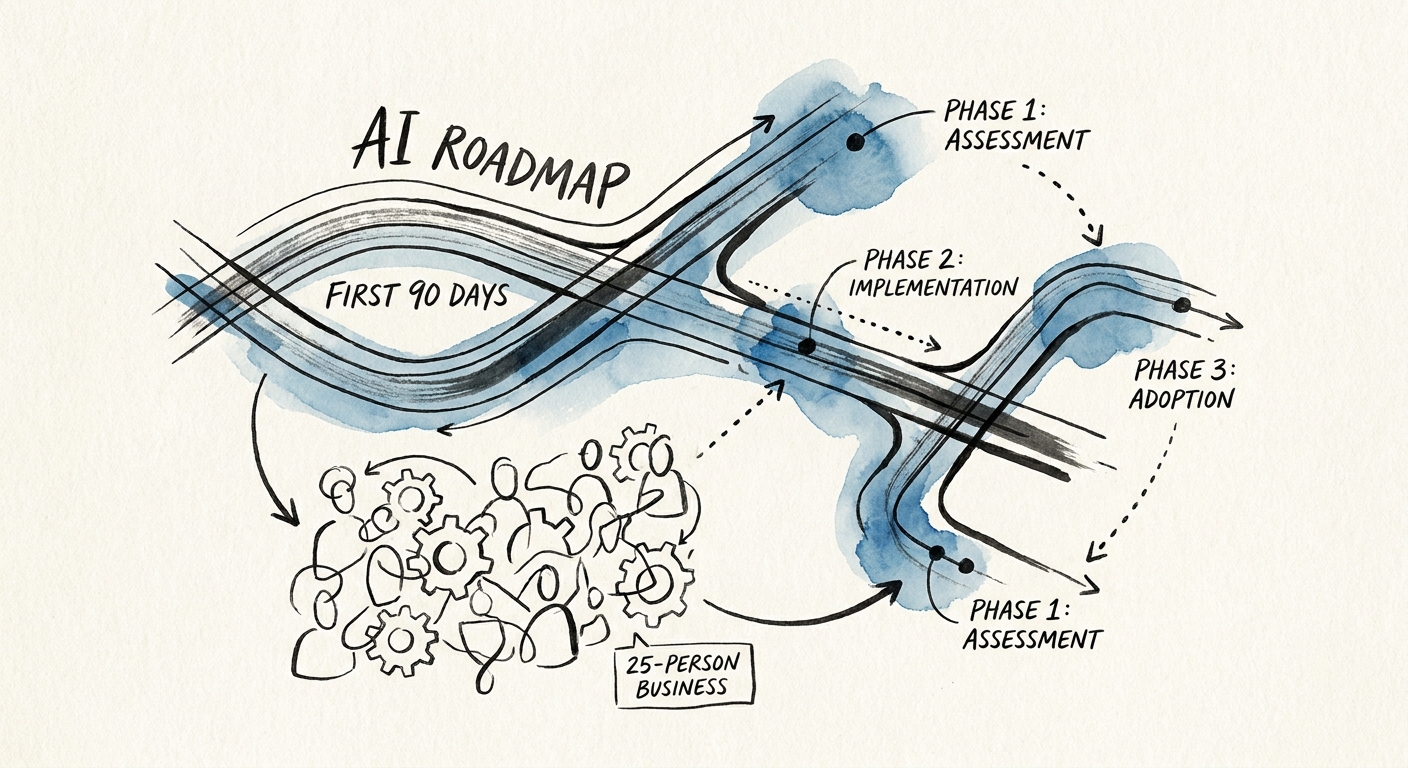
At 25 people there's no IT department and the owner signs off on everything. A 90-day AI plan to fix one workflow without leaking data or buying tool sprawl.
BRIEF · 6 min
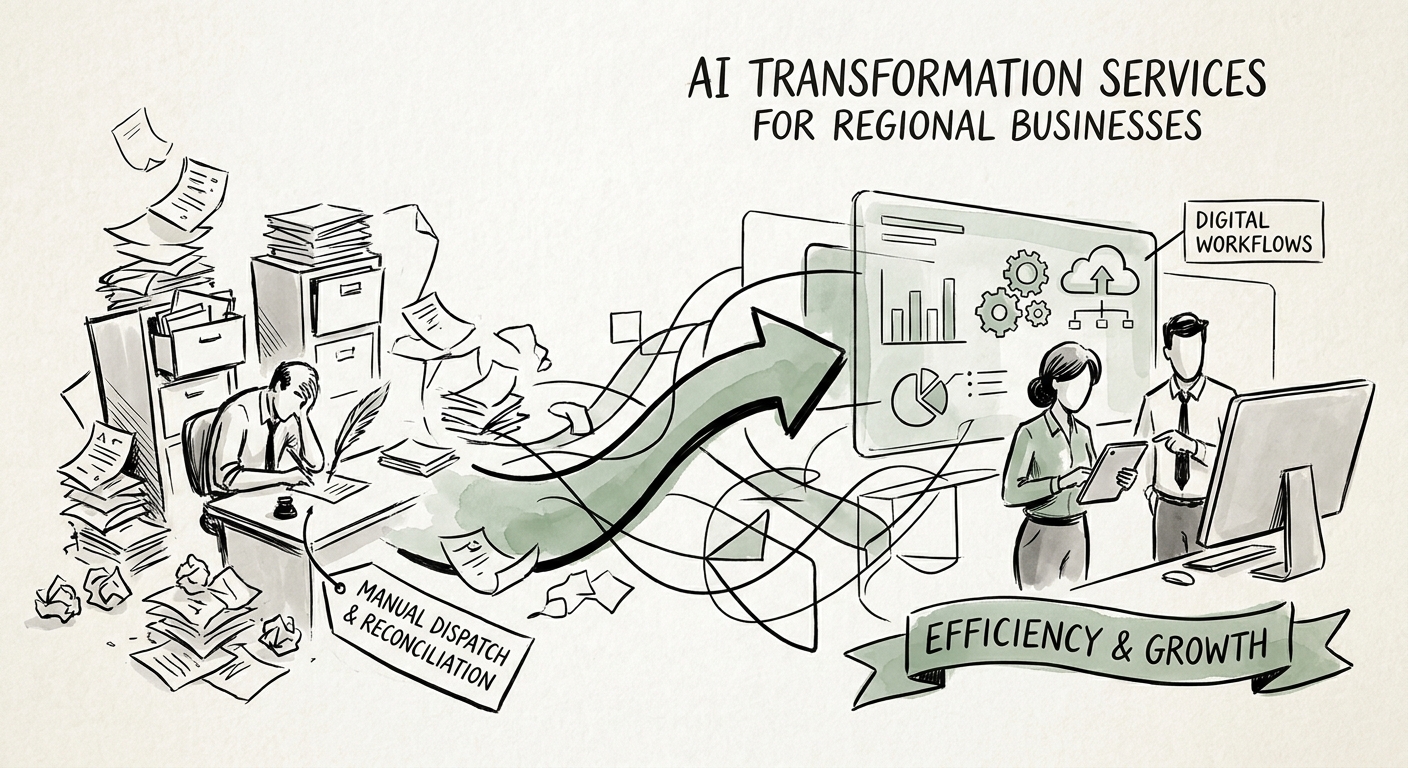
Your AI pilot worked at one branch. Then it hit the second location and fell apart. How regional operators pick the workflow, control the data, and scale across sites.
BRIEF · 6 min
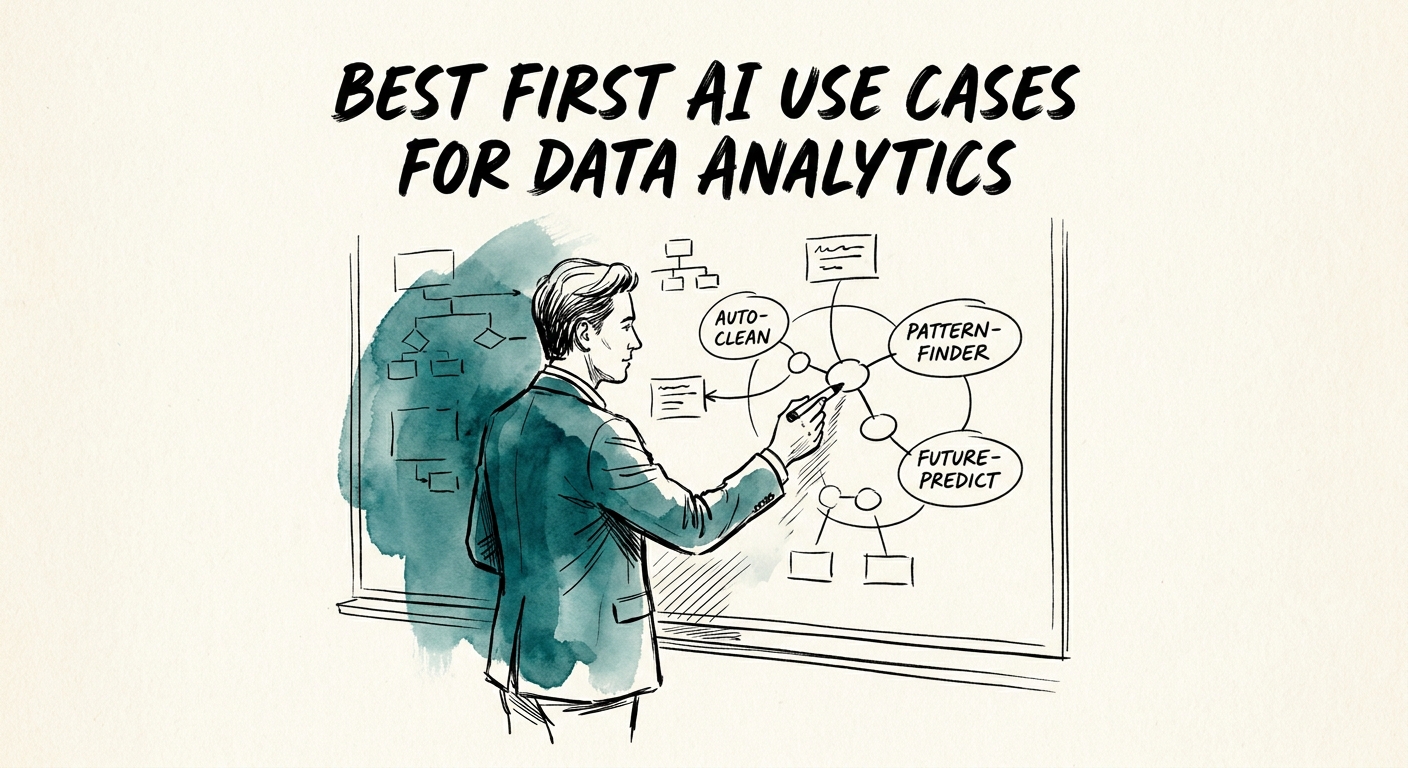
Where data analytics consultancies should actually start with AI: metric-definition QA, dbt and dashboard review, and provenance you can trace — not auto-generated insight.
BRIEF · 6 min
In a family-owned company, the best first AI use case isn't the flashiest one — it's the routine work locked in one person's head. Here's how to pick it.
BRIEF · 6 min
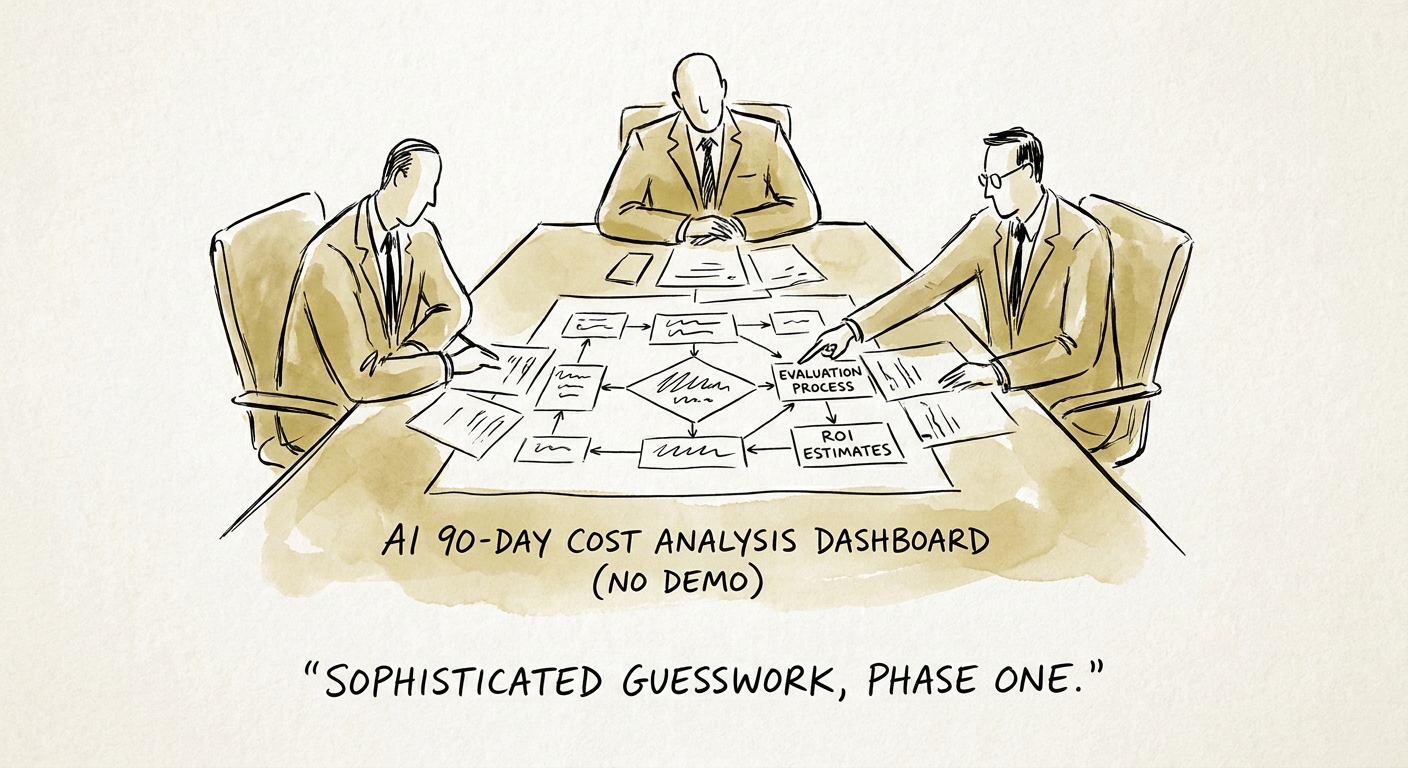
The demo shows you the license fee. The real AI implementation cost lives in data cleanup, permissions, review capacity, and adoption. Here's how to price it.
BRIEF · 6 min
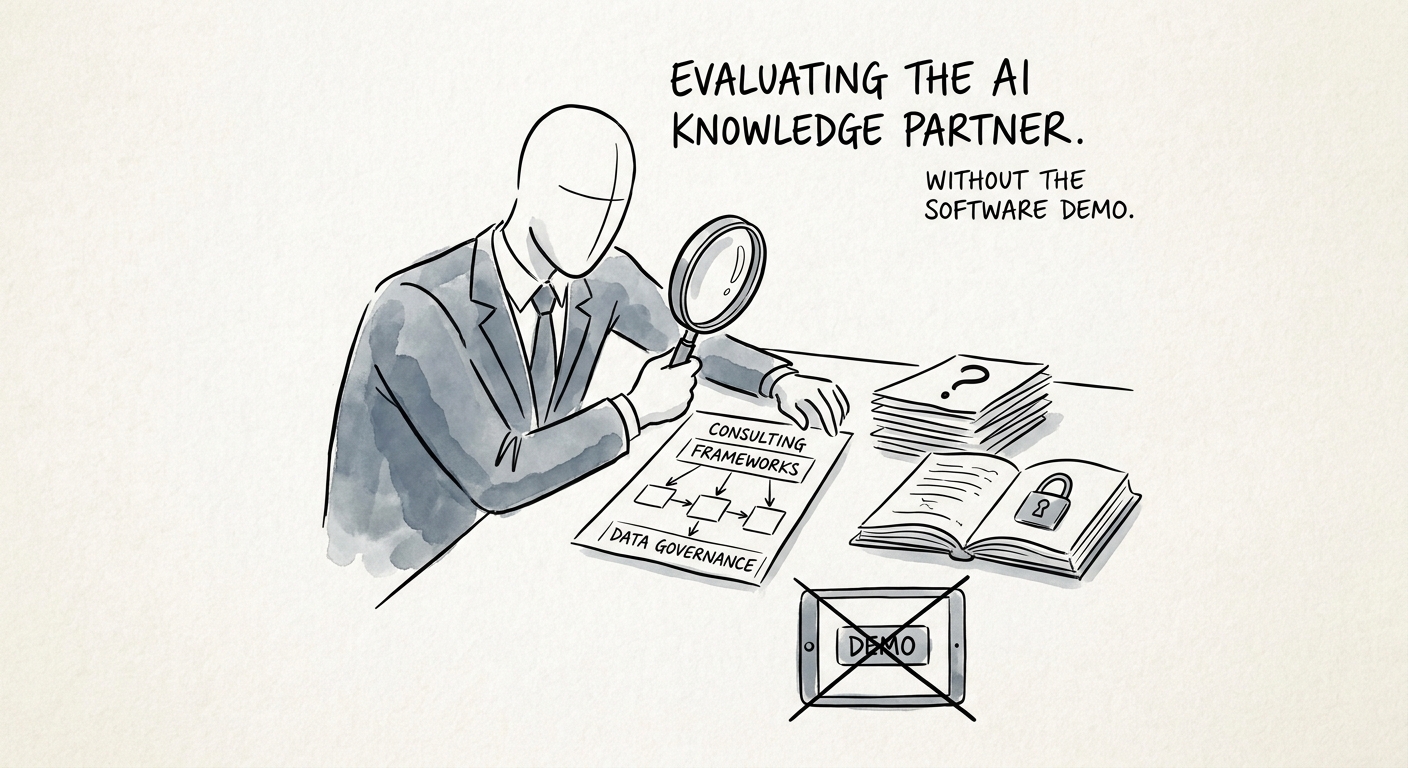
A professional services buyer's guide to evaluating AI knowledge assistant consultants: how to test for stale sources, permission leaks, and answers your firm can trust.
BRIEF · 6 min
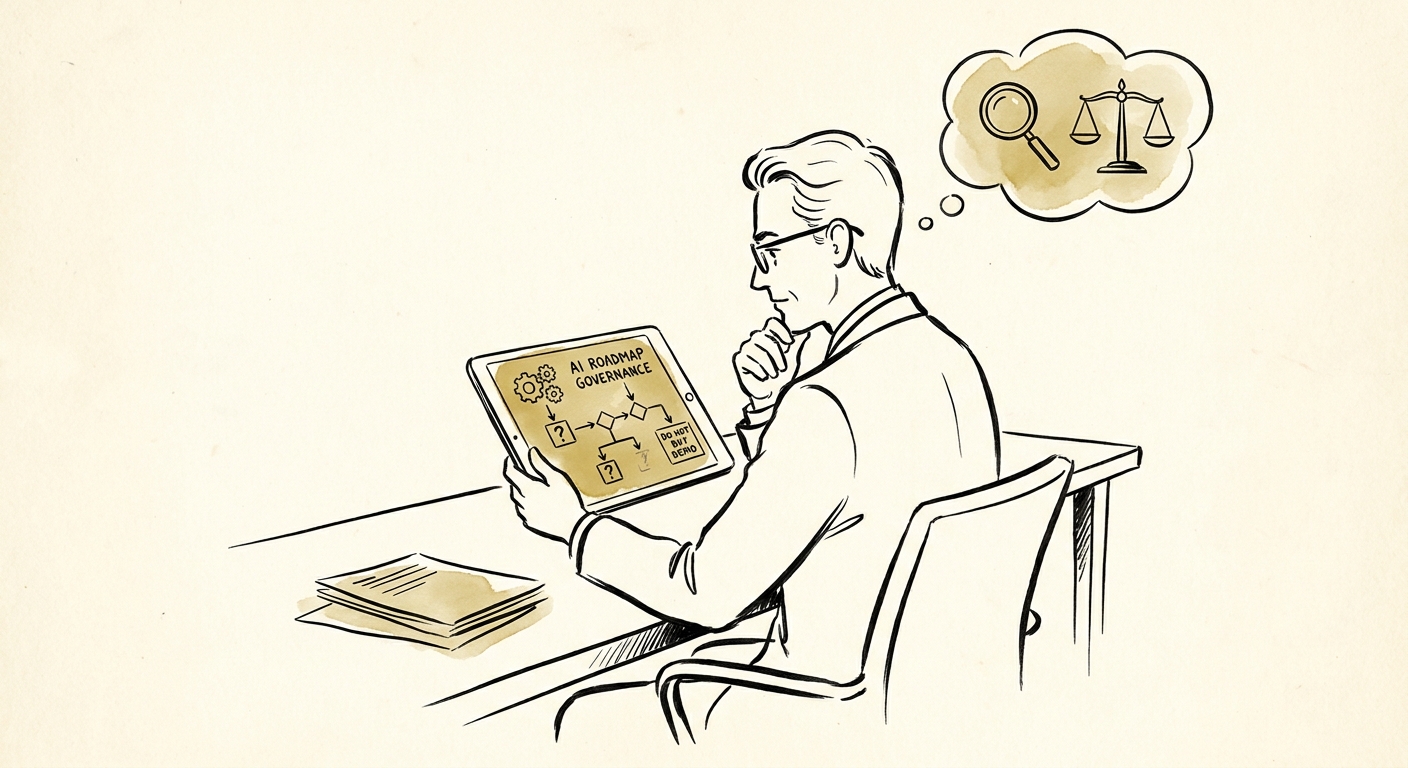
Most AI roadmaps are 40 slides of phases that never reach a real workflow. Five questions that separate an operating plan from a tool tour for SMB and mid-market buyers.
TOPICS
Each topic groups field notes by the constraint they address — from revenue architecture and unit economics to founder extraction, technical debt, and post-close integration.
COMMERCIAL PERFORMANCE
Customer profile, deal-desk, sales-engineering ratios, MEDDPICC, deal-stage definitions. Move win rates from 29% to 68%.
Open topicCOMMERCIAL PERFORMANCE
Pipeline coverage, top-down/bottom-up motion, AE/SE ratios, comp realignment, partner-channel structure.
Open topicCOMMERCIAL PERFORMANCE
CAC payback, NRR, gross margin by segment, cohort analysis, paid-on-bookings vs. paid-on-cash.
Open topicCOMMERCIAL PERFORMANCE
ARR waterfalls, deferred-revenue rules, board-pack standardization, FP&A architecture.
Open topicOPERATIONAL EXCELLENCE
Mapping every decision the founder still owns, then engineering the systems and people that replace each one.
Open topicOPERATIONAL EXCELLENCE
Sales process, customer success playbooks, technical runbooks, financial close calendars, hiring rubrics.
Open topicOPERATIONAL EXCELLENCE
Org design for scale, comp band rationalization, hiring rubrics with 92% accuracy across 40+ hires.
Open topicOPERATIONAL EXCELLENCE
Pre-LOI cleanup. Financial reporting normalization, contract hygiene, IP assignment review, customer-concentration mitigation.
Open topicTURNAROUND & RESTRUCTURING
Stalled programs unblocked. We've rescued $13M and $3M Fortune 500 initiatives in under 30 days.
Open topicTURNAROUND & RESTRUCTURING
Quantification in dollars, not adjectives. Then a remediation plan that runs in parallel with delivery.
Open topicTURNAROUND & RESTRUCTURING
Post-merger integrations that hold customer and staff retention. 95% / 100% achieved on complex divestitures.
Open topicTURNAROUND & RESTRUCTURING
SOC 2, CMMC, FedRAMP, security baselines for post-acquisition standardization.
Open topicAI TRANSFORMATION
AI roadmap, readiness, use-case selection, implementation sequencing, and operating-model design for growing businesses.
Open topicAI TRANSFORMATION
Manual-work discovery, workflow redesign, automation boundaries, adoption plans, and operational measurement.
Open topicAI TRANSFORMATION
Agent readiness, internal copilots, human review, escalation rules, logs, and control design.
Open topicAI TRANSFORMATION
RAG, internal knowledge assistants, source readiness, access control, answer quality, and documentation operations.
Open topicAI TRANSFORMATION
Acceptable-use policy, shadow AI, employee training, privacy boundaries, quality review, and leadership cadence.
Open topicAI TRANSFORMATION
Sales, marketing, support, operations, finance, HR, and IT workflows where AI can improve speed, quality, and visibility.
Open topicAI TRANSFORMATION
Professional services, technology services, healthcare administration, manufacturing, construction, retail, and nonprofit AI workflows.
Open topicAI TRANSFORMATION
Vendor selection, build-vs-buy decisions, platform fit, data access, integration cost, and switching risk.
Open topicAI TRANSFORMATION
AI ROI, payback period, time savings, quality lift, revenue response, cost avoidance, and adoption metrics.
Open topicABOUT THE PUBLICATION
Market Intelligence is the workshop log. It ships when there is something to say, not on a content calendar.