
The practical answer
- Short answer
- At $10M ARR your finance stack snaps. Here's the 90-day rebuild that drops month-end close from 15 days to under 5 and makes your forecast trustworthy.
- Best fit
- Industry: B2B Tech. Function: Finance / FP&A
- Operating path
- Financial Infrastructure → Commercial Performance → Valuations
- Key metric
- 4.8 Days Average monthly close time for top-quartile finance teams (vs. 10+ days for bottom quartile).
The week your one finance hire opens the wrong tab
Picture the Thursday before a board meeting at a $14M ARR SaaS company. The controller — your entire finance department, hired when you were at $3M — is rebuilding the burn forecast in the same 40-tab workbook she's nursed since the seed round. A linked cell in tab 31 is pointing at last quarter's headcount plan. Nobody notices. The board deck goes out showing 11 months of runway. The real number, it turns out three weeks later, is seven.
That is not a competence problem. It is an infrastructure problem, and it shows up at a remarkably predictable moment: somewhere between $10M and $20M in recurring revenue, when you are running a Series B engine on the financial plumbing that got you to Series A. The revenue tripled. The transaction volume, the entity count, the vendor list, the comp plans, and the investor scrutiny all tripled with it. The finance function did not.
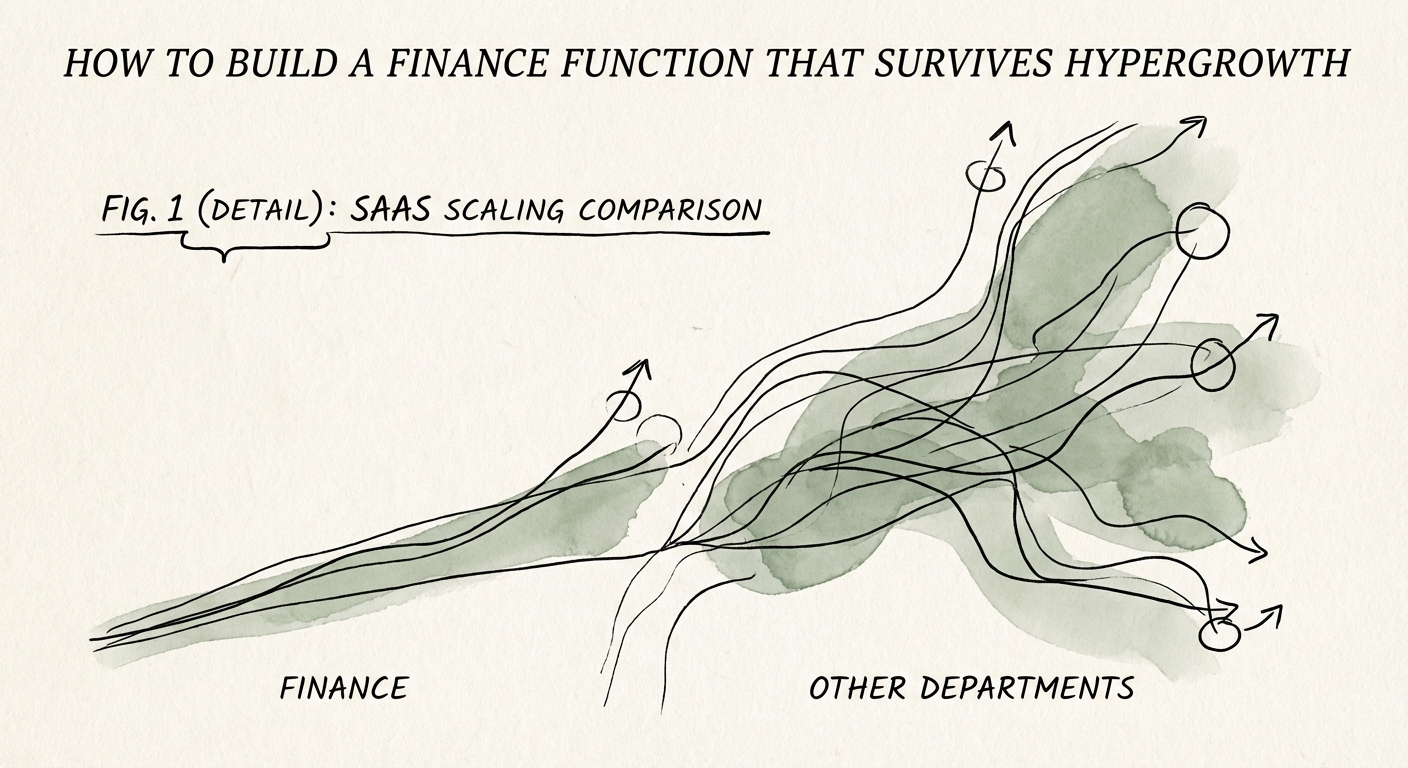
Benchmark data shows finance teams in high-growth SaaS scale roughly 4.9x faster than other departments as the business matures — yet most founders treat that growth as a cost to defer rather than a system to design (Ledge). So they keep finance framed as compliance — taxes, audit prep, paying the vendors — instead of what it actually becomes after Series B: the function that tells you whether you can afford the GTM bet your new VP of Sales just pitched.
You're past the cliff if any two of these are true
- Your close runs 12 to 15 days. By the time the books are reconciled, you're already a third of the way into the next month and steering with a rear-view mirror.
- You missed last quarter's EBITDA by double digits and called it "timing." Costs that should have been accrued surfaced as a week-11 surprise because nothing was being accrued in the first place.
- Exactly one person can open the model. Your financial intelligence has a single point of failure, and that person is fielding recruiter messages.
None of these reads as urgent on a Tuesday. They read as urgent the day a Series C lead's diligence team asks for a clean monthly revenue waterfall going back eight quarters and you realize you cannot produce one without two weeks of cleanup.
Sophisticated investors don't just audit your numbers; they audit your ability to produce numbers on demand. A 15-day close tells them you don't know your own business yet — and they price that uncertainty straight into the multiple.
Fix the machine, not the headcount
The reflex when finance breaks is to add bodies — another accountant for AP, another analyst to babysit the model. It rarely works, because you're hiring people to perform the manual labor a broken process creates. You can't out-staff a 15-day close; you can only make it a more expensive 15-day close.
The number worth anchoring on: top-quartile SaaS finance teams close in 4.8 days while the bottom quartile takes 10-plus (CFO.com). That five-day gap is not about working harder. It's the difference between a function that spends its days reconciling the past and one that spends them modeling the future. Buy back those five days with system design, in this order.
Retire the tools that quietly stopped scaling
QuickBooks plus Excel is a genuinely good answer up to roughly $8-10M ARR. Past that, it stops being thrift and starts being risk. Three moves, ranked by payback:
- General ledger first. Move to NetSuite or Sage Intacct. You need multi-entity consolidation and dimensional tagging — every dollar coded to a department, product line, and customer — because that is the granularity a Series C diligence team will demand, and you cannot retrofit it under deadline.
- FP&A second. Pull forecasting out of spreadsheets into a tool like Cube, Vareto, or Pigment that reads live from your GL, CRM, and HRIS. The win isn't prettier charts; it's that your forecast stops being a hand-keyed artifact and becomes a query against current reality.
- Spend management third. If invoices still arrive as PDFs to an AP inbox, Ramp or Brex automates categorization and approvals and frees a meaningful slice of your finance team's week for analysis instead of data entry.
The sequencing principle — connected systems beat isolated ones — is the same one that governs a messy integration; we work through it in our guide on post-merger technology stack consolidation.
Make the forecast cost something to miss
A forecast nobody is accountable to is a wish. The fastest fix isn't a better model — it's a feedback loop. Each month, any budget owner whose actuals miss plan by more than 5% explains the variance in writing to the room. That single ritual converts forecasting from a finance chore into an operating discipline the whole leadership team owns, and the discipline compounds: rigorous forecasting processes are associated with a 103% improvement in quota attainment because capital flows to what's actually working instead of what looked good in January (Kluster). For the sales side of this specifically, see from guessing to 92% accuracy.
The 90-day rebuild, sequenced so you don't stall
You do not need a two-year transformation. You need a 90-day intervention with one non-negotiable outcome per month. Run them in this order — each phase is load-bearing for the next.
Days 1-30 — Get the close under 5 days
You cannot forecast a future you can't reconcile, so stabilize the books first. Shift from a month-end scramble to a continuous close: reconcile bank accounts weekly instead of in one panicked batch, automate recurring accruals so vendor costs stop ambushing you in week 11, and write down the close checklist so it survives the controller's vacation. The target is concrete — under five days — and it's the prerequisite for everything that follows.
Days 31-60 — Replace the annual budget with a rolling forecast
The annual budget is obsolete the day you approve it. Kill it. Stand up a 12-month rolling forecast you re-run every month against actuals, with explicit hiring and spend triggers tied to revenue performance rather than to the optimistic slide from January. Now when the new VP of Sales asks for three more reps, you have a model that answers in an afternoon instead of a debate.
Days 61-90 — Rebuild the board package around decisions, not trivia
Your board does not need the Austin office electricity bill. They need CAC payback trends, net revenue retention by cohort, and your Magic Number — the metrics that tell them whether to lean in on the next round and at what price. Structure the package around the "why," and the same numbers that satisfy your board become the diligence pack that compresses your next raise.
For exactly which metrics to put in front of investors, work from our CFO's guide to SaaS metrics for board reporting.
What you actually buy
Do this and the Thursday-before-the-board scene above stops being possible — the runway number is right because the close is clean, the forecast is trustworthy because someone owns every variance, and the diligence pack already exists because you built it into the monthly rhythm. The market pays a premium for predictability at Series C and at exit. The 90 days is how you build the machine that produces it on demand instead of in a panic.