The practical answer
- Short answer
- New 2025 data shows EBITDA margins hitting a decade low of 9.8% despite stable project margins. Here is the diagnostic framework to recapture lost profitability.
- Best fit
- Industry: Tech Services. Function: Operations
- Operating path
- Unit Economics → Commercial Performance → Transaction Advisory Services
- Key metric
- 68.9% Average Billable Utilization in 2025 (Down from historic ~75%)
The 26% Gap That Sales Can't Fix
For the last three years, the mandate has been growth. You hired sales reps, expanded marketing, and celebrated every closed contract. But the bank account tells a different story. According to the 2025 SPI Professional Services Maturity Benchmark, you aren't alone. While project margins have remained relatively stable at 35.9%, overall EBITDA margins have crashed to a decade low of 9.8%.
Do the math. You are making 36 cents on the dollar when you deliver the work, but only keeping 10 cents at the bottom line. That 26% delta isn't just "overhead." It is Delivery Debt. It is the cost of inefficiency, tribal knowledge, and the heroics required to get every project across the finish line.
For a founder-led firm, this is the danger zone. You are likely seeing revenue growth slow to the new industry average of 4.6%, yet you are working harder than ever. The problem isn't that you aren't selling enough. The problem is that your delivery model leaks profit faster than your sales team can pour it in. You are running a leaky bucket operation where increased volume just accelerates the spill.
You are making 36 cents on the dollar when you deliver the work, but only keeping 10 cents at the bottom line. That 26% delta isn't just 'overhead.' It is Delivery Debt.
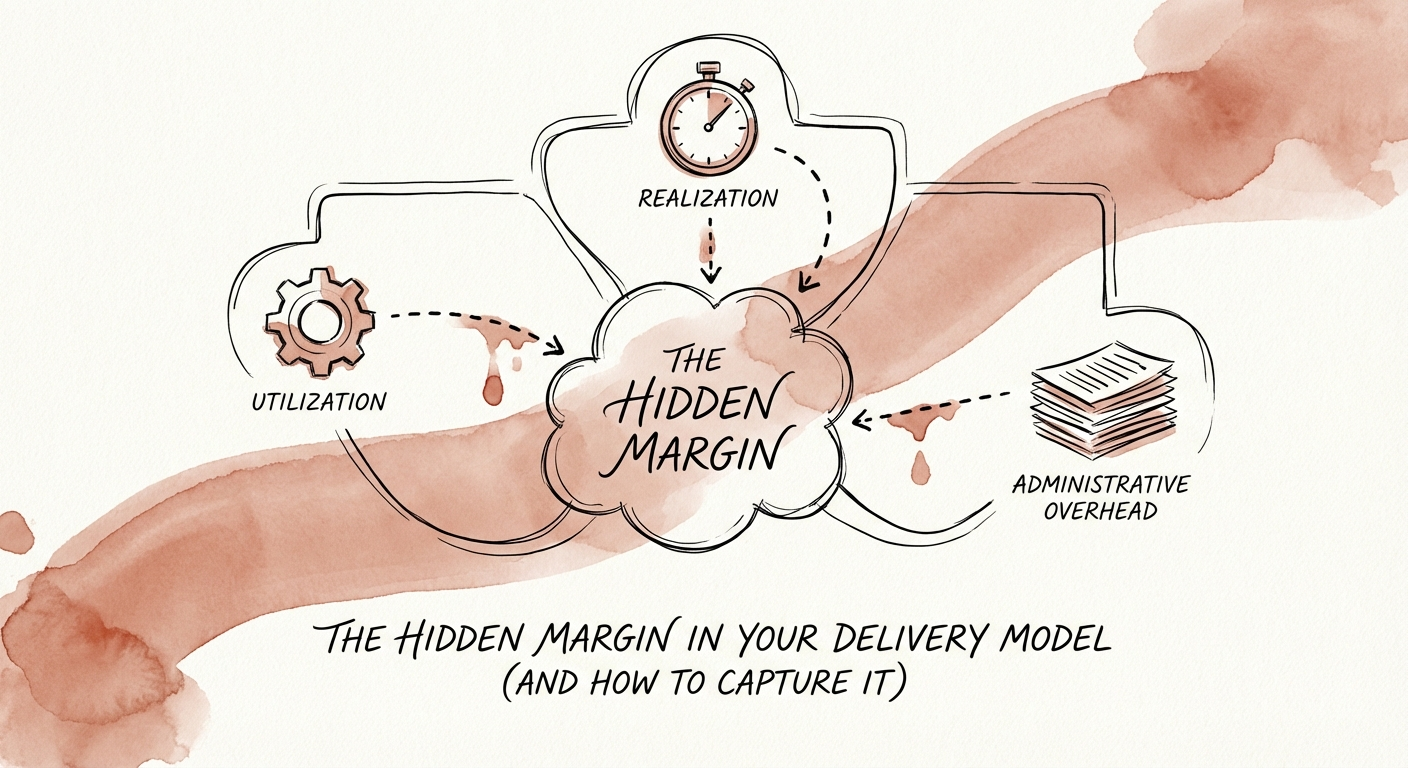
The Diagnostic: Where the Margin Goes to Die
If you want to find the hidden margin, you have to look beyond the P&L and into the timesheets. The single biggest killer of services profitability in 2025 was Billable Utilization, which dropped to 68.9% against a target of 75-80%.
In a 50-person firm, that gap—the difference between 69% and 75% utilization—is roughly equivalent to $1.5M in lost revenue that costs zero incremental dollars to deliver. It is pure margin.
The Three Silent Killers of Utilization
- The "Custom" Tax: Every project starts with a blank whiteboard. Your team reinvents the wheel for every client, turning what should be a 100-hour implementation into a 150-hour slog.
- The Non-Billable Creep: Your senior engineers—your most expensive assets—are spending 15 hours a week on non-billable administrative tasks, pre-sales support, and fixing bad handovers.
- The Realization Gap: You might be utilizing people at 75%, but if you're writing off hours because the project went over budget, your realized rate plummets. High utilization with low realization is the hallmark of a firm that doesn't know how to scope.
Data from SPI Research indicates that firms with high process maturity (Level 5) generate 265% higher profit margins than their ad-hoc peers. The difference isn't the software they sell; it's the machine they built to deliver it.
The Fix: From Brute Force to Engineered Delivery
Recapturing that lost 15-20% margin requires shifting from a "Hero-Based" model to a "Systems-Based" model. You cannot simply demand your team work harder; you must engineer the friction out of their day.
1. Standardize to Productize
Stop selling "hours" and start selling "outcomes." Create standard operating procedures (SOPs) for the 80% of tasks that are repeatable. If you can standardize your delivery, you can move delivery down to lower-cost resources (or automation) while keeping your senior talent focused on high-value strategy. This is how you break the linear relationship between revenue and headcount.
2. Automate the Administration
The 2025 data is clear: firms leveraging AI for resource planning and automation are significantly outperforming laggards. Use AI agents to handle the non-billable burden—scheduling, timesheet chasers, and basic code generation. If you can reclaim 5 hours a week for your billable staff, your utilization problem solves itself.
3. The 75% Mandate
Set a hard floor. Utilization below 75% for delivery staff is an emergency. It warrants the same level of executive panic as a missed sales quarter. But don't just whip the horse; clear the path. Remove the internal meetings, the vague scopes, and the administrative debris blocking their billable time.
The market has shifted. Growth at all costs is dead. The winners of 2026 will be the firms that master the boring, unsexy mechanics of Unit Economics. Your margin is there. It's just hiding in your timesheets.