
The practical answer
- Short answer
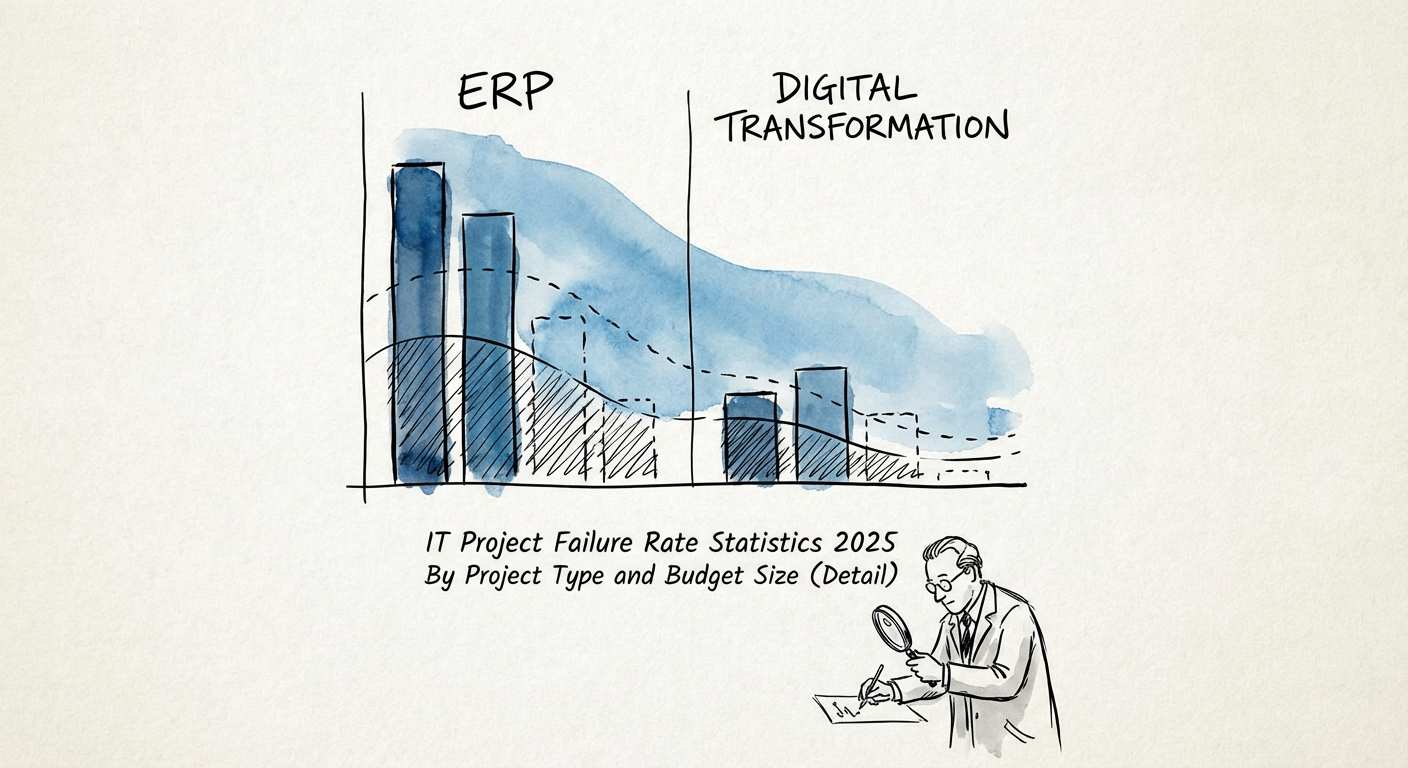
- A project's failure odds jump the moment its budget crosses $1M. 2025 failure rates by budget tier and by type (ERP, digital transformation), with the math.
- Best fit
- Industry: B2B Tech / Enterprise. Function: Engineering / IT
- Operating path
- Project Recovery → Turnaround & Restructuring → Transaction Execution Services
- Key metric
- 45% Avg. Budget Overrun for Projects >$15M (McKinsey)
The board approved a budget. It accidentally approved a probability.
When a steering committee signs off on a $4 million ERP replacement, everyone in the room thinks they approved a scope. What they actually approved was a spot on a risk curve — and nobody read it to them. The uncomfortable truth buried in the 2025 data is that the size of the check is one of the strongest predictors of whether the project ships at all. Not the team. Not the vendor. The number.
Here is the part that doesn't fit on a slide: risk doesn't scale with budget, it accelerates with it. A $300K project and a $3M project are not the same project ten times over. The $3M version has more integration points, more stakeholders who can each veto "done," more months for requirements to drift, and more political weight that makes anyone reluctant to call it red. Complexity compounds. The dollars are just the visible proxy for it.
And the cost of getting it wrong at the top of that curve is no longer a missed quarter. PMI's research pegs the waste at roughly $109 million lost for every $1 billion invested in projects. For an enterprise CIO, a failed nine-figure transformation isn't a line item — it's the thing the next CIO inherits. So before you defend the schedule, look at where your budget actually puts you on the curve. A real intervention starts with admitting which tier you're in.
The number that should scare a CIO isn't the failure rate. It's the slope: every zero you add to the budget bends the risk curve up faster than the value curve.
The failure rate is not a single number — it's a staircase
Aggregate "70% of transformations fail" headlines are useless to a leader trying to make a decision, because they flatten the one variable that matters: scale. McKinsey and Oxford's work on large initiatives found the big ones run about 45% over budget while delivering roughly 56% less value than promised. Read those two figures together and the loss isn't additive — you pay more and get less, on the same project, at the same time. That's the staircase, tier by tier:
- Under ~$1M: The lowest failure band. When these die, it's usually starvation — too few people, borrowed attention, a sponsor who moved on. Recoverable, often quietly.
- $1M to roughly $5M: The step where governance stops fitting the spend. The project is now big enough to need real program management but is still being run like the small one that worked last year. This is where "on track" and "actually on track" start to diverge.
- $15M and up: The McKinsey/Oxford zone. Cost overruns and value shortfalls become the base case, not the exception. The budget is large enough that nobody wants to be the one who says stop.
Now overlay project type, because the staircase is steeper for some than others. Gartner's ERP outlook is brutal for the multi-year, multi-module replacements — and the harder the manufacturing or supply-chain complexity, the worse it gets. Bain's transformation analysis lands even higher for the sprawling "reinvent the operating model" programs, because their failure mode isn't a bug — it's that no two executives ever agreed on what success looked like. And the Standish CHAOS benchmarks show the largest, most bureaucratic builds clustering at the top of the failure range. The pattern is consistent: the more "transformational" the pitch and the bigger the budget that pitch unlocked, the lower the odds it lands. If you're running a transformation stuck in committee, the budget tier already told you the risk; committee paralysis is just it arriving on schedule.
What you do Monday if you're in the wrong tier
Say you're the CIO on a $6M ERP cutover that's been "90% done" for two quarters. You can't shrink the budget you already approved, but you can stop treating the project like the cheaper, simpler one your governance was built for. Three moves, in order:
1. Re-tier the governance to match the check. If the spend jumped a tier but the cadence didn't, that gap is your failure mode. A $6M build doesn't survive on the same weekly status meeting that ran a $400K rollout. Map your actual reporting rhythm against the budget tier and close the mismatch this week — that's the cheapest risk reduction available, and it costs zero engineering hours.
2. Run a 30-day reality reset and freeze net-new scope. Declare a deliberate red status. Build nothing new for 30 days; spend the time validating the true critical path and auditing what's actually working against what the deck claims. A structured triage beats one more sprint of building on a foundation nobody has verified.
3. Price the sunk cost honestly, then decide. The instinct at the top of the budget curve is to protect the investment by adding to it — exactly the move the data punishes. If the architecture is wrong or the vendor has missed three months running, a write-down now is cheaper than the larger write-down a year of denial buys you. The hardest sentence a CIO says is "we are not going to finish this as scoped." It's also the one that stops the bleed. Your budget put you on this curve at approval. Your governance is the only thing that decides where on it you actually land.