
The practical answer
- Short answer
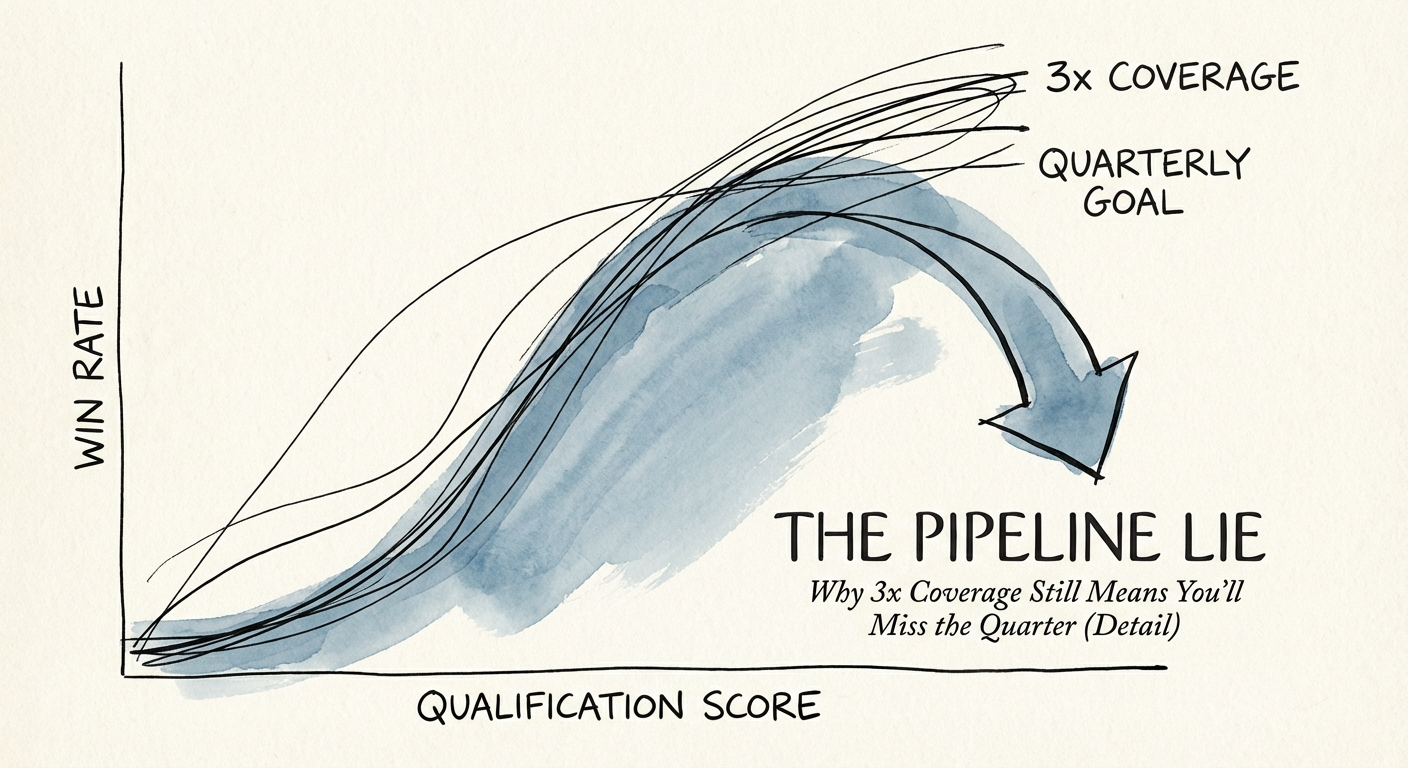
- Your VP says 3.2x coverage. At a 19% win rate, that books only about $608K of a $1M quota -- a 39% miss. Here is the forecast math "healthy" pipeline hides.
- Best fit
- Industry: B2B Tech. Function: Sales Operations
- Operating path
- GTM Execution → Commercial Performance → Performance Improvement
- Key metric
- 19% Average B2B Win Rate in 2025, down from 29% previously.
The board deck is wrong before you open it
It's the Friday before the QBR. You're staring at the "Committed" tab, and your VP of Sales has already told you the line you wanted to hear: 3.2x coverage, plenty of room, we've got the quarter. The slide is built. The number is bold and green.
You will still miss. Not because the team is lazy and not because the market vanished overnight — but because the formula under that green number quietly stopped working, and nobody updated the spreadsheet.
Here is the original logic. The "3x rule" assumes you close roughly one in three deals. Carry 3x your target in pipeline, the math says, and a 33% win rate lands you on plan. That held when capital was cheap and a "digital transformation" budget was a blank check. It does not hold now. The 2025 Ebsta + Pavilion B2B Sales Benchmark Report puts the average win rate at roughly 19% — down from the 29% the previous generation of playbooks was built on.
So run the actual arithmetic on your own deck. $3.2M of pipeline against a $1M target is your 3.2x. Apply a 19% close rate and you book about $608,000. You don't have a buffer. You have a 39% miss with a presentation already attached to it. The coverage ratio didn't lie to you on purpose — it's answering a question ("how much did we write down?") that has almost nothing to do with the question you actually need answered ("how much is going to close?").
Coverage tells you how much you wrote down. Velocity tells you what's actually going to close. Founders keep funding the first number and getting surprised by the second.
Why "healthy" pipeline is mostly inventory
The win rate didn't collapse because reps forgot how to sell. It collapsed because the word "opportunity" got cheaper. When a founder leans on a sales leader for coverage, the leader produces coverage — the same way a warehouse manager hits an inventory target by counting the boxes that have been sitting in the back for a year. The number goes up. The reality doesn't move.
What fills the gap is stalled deals: opportunities that have pushed their close date three or more times, have no next meeting confirmed in writing, and are "waiting on a budget committee" that last met in Q1. They're not closed-lost, so they stay on the board. They're not closing either. Topo.io's teardown of the 3x myth makes the point that coverage as a single ratio hides exactly this — it treats a deal born last week and a deal that's been rotting since February as equal units of "pipeline."
The Ebsta data shows how wide that gap actually is. A well-qualified deal is 6.3x more likely to close than a poorly qualified one. Between 36% and 44% of deals now slip past their original close date. And the AI angle compounds it: Gartner found that sellers who partner with AI on qualification and prep are 3.7x more likely to hit quota — which tells you the spread between your top reps and the rest is now measured in process, not effort.
This is why the standard weighted forecast — "Stage 3 is 40%, so multiply" — is the single most expensive habit in your CRM. A Stage 3 deal that's been frozen for 90 days has a real win probability closer to 5% than 40%. The flat percentage launders that deal into your number. You're not forecasting; you're averaging a fresh deal and a corpse and calling the result "most likely." The honest move isn't "go get 5x of the same stuff." It's 3x of pipeline that survives a real scrub — coverage of reality, not coverage of optimism.
A 30-day fix you can start Monday
You don't fix this with a motivational all-hands. You fix it by changing what's allowed to count as pipeline. Three moves, in order.
Run a demolition, not a forecast call. Block four hours and kill every deal that fails three tests. The age test: if an opportunity is older than 1.5x your average sales cycle, it's closed-lost — move it to nurture, but it leaves the forecast. The next-step test: if there is no calendar invite sent and accepted for the next meeting, it's a lead, not an opportunity. The power test: if nobody on your side has spoken to an actual decision-maker by Stage 3, it drops back to Stage 1. Expect to wipe out 30-40% of your stated pipeline value in one afternoon. That's the point. Panicking in week 2, when you can still build pipeline, beats getting surprised in week 11, when you can't.
Define stages by what the buyer did, not what the rep did. "Sent proposal" is a rep activity and tells you nothing. "Buyer confirmed budget," "redlines received," "mutual action plan signed" — those are buyer commitments, and they're the only things that move forecast probability. Lock the CRM so a rep can't advance a stage without the evidence attached. Happy ears stop inflating your ratio the moment the stage gate requires a buyer's fingerprint.
Report coverage by category, never as one number. Split it: Commit (should be 95% likely), Most Likely (apply your actual historical win rate, not the aspirational one), Best Case (risk-adjusted, maybe 10%). The test is brutal and simple — if your Commit bucket alone covers ~80% of target, you're safe. If you need Best Case deals to make the number, you've already missed; you just don't know it yet.
Coverage was a security blanket for a zero-interest-rate world. Validity is the metric that survived. If you want the longer build on getting from gut-feel guessing to a forecast you can actually bank a board promise on, start with how to fix broken sales forecasting, then tighten the top of the funnel with why elite firms win the bids they choose to write. The principle underneath all of it: if you can't prove the deal is real, it doesn't belong in the number — no matter how badly the QBR slide wants it there.