
The practical answer
- Short answer
- 2025 billable utilization fell to 68.9%. The by-role targets — 80% analysts, 70% managers, 50% principals, 30% partners — and why a flat number burns margin.
- Best fit
- Industry: Professional Services. Function: Operations
- Operating path
- Unit Economics → Commercial Performance → Transaction Advisory Services
- Key metric
- 68.9% Average 2025 Billable Utilization (Down from 73.2%)
One Number, Four Wrong Answers
Here is the slide that should worry you more than the headline: the industry's average billable utilization dropped to 68.9% in 2025, per SPI Research's Professional Services Maturity™ Benchmark — the lowest in five years, down from 73.2%. But the firm-wide average is a lie of omission. It hides the only number that actually moves margin: who is billing.
Picture a 60-person consultancy that runs a single target — "everyone hits 75%." On the surface it looks disciplined. Underneath, the staffing pyramid is quietly inverted. The two principals, the people who should be opening accounts and pricing the next engagement, are buried at 85% delivery because they're the only ones who can do the hard work cleanly. Meanwhile a third of the analysts sit at 55%, "available" but unstaffed, because no one has time to scope work for them. The firm-wide number reads 72%. Looks fine. It is bleeding from both ends.
That is the trap a flat target sets. Kantata's State of Professional Services work has been blunt about it for years: utilization that isn't read by role is a vanity metric. A single percentage tells you the building is occupied. It tells you nothing about whether the right hours are billable. And in a year where SPI Research pegs EBITDA at 9.8% — also a decade low — the firms that hold margin are the ones that stopped managing the average and started managing the curve.
A flat utilization target is the cheapest-looking policy in the firm and the most expensive to run. It overworks the people who should be selling and lets the people who should be billing coast.
The 80/70/50/30 Curve, and What Each Tier Is Actually For
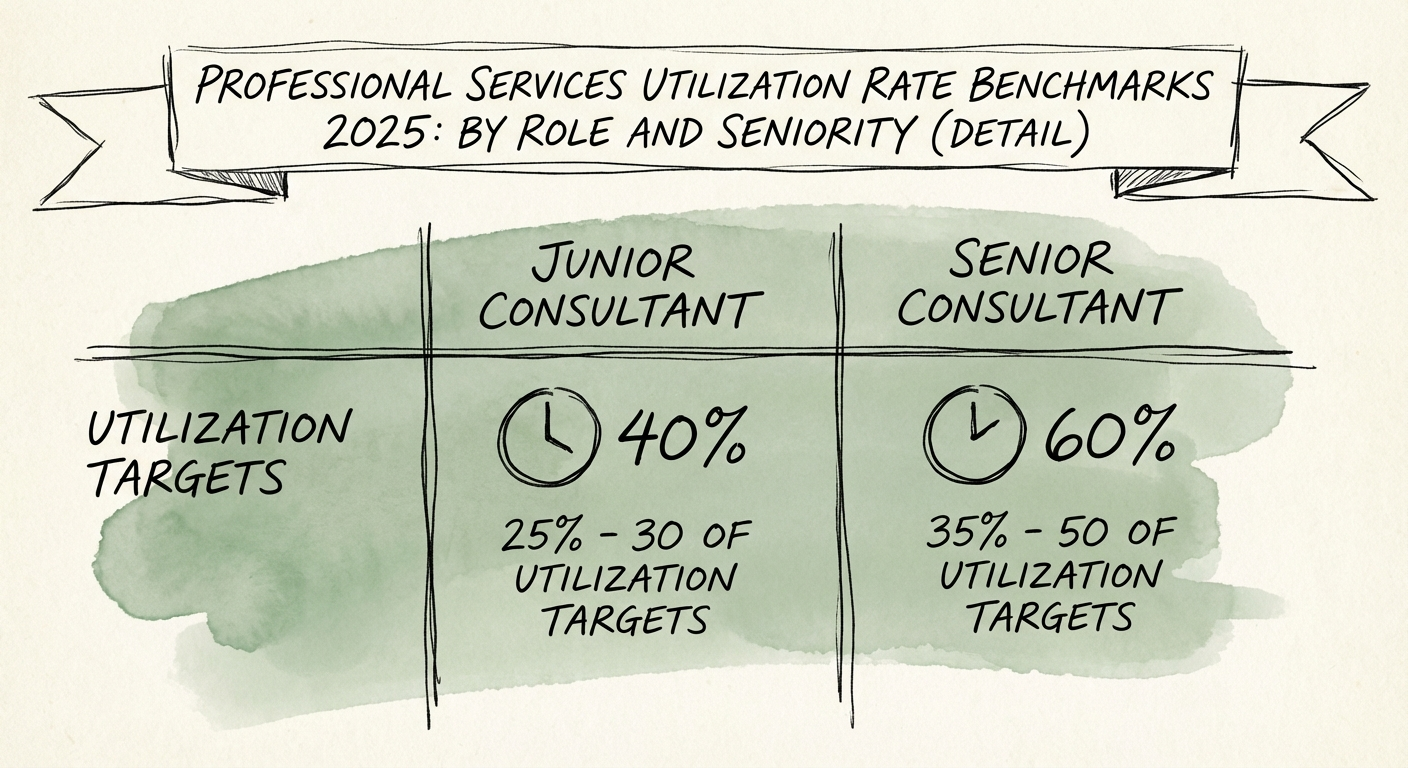
Cross-reference the role-level data in the SPI, Kantata, and Deltek 2025 benchmarks and a clean shape falls out. As you move up the pyramid, billable hours should decline on purpose — because each tier exists to do a different job. The mistake isn't the number; it's not knowing what the number is buying.
Analyst / Associate — target 80–85%. No quota, no governance load, no mentoring duty. They are pure production capacity. If an analyst is below 75%, that's almost never a performance problem — it's a scoping or pipeline problem one level up. Below 70% and you are paying salary to keep a seat warm while someone senior does work they should be handing down.
Manager / Project Lead — target 70–75%. The hardest seat in the firm. They deliver and run governance, escalations, and the analysts' work plans. The roughly 10-point drop from the analyst tier isn't slack — it's the context-switching tax, and it's load-bearing. Push a manager back to 80% and the first thing that disappears is the half-hour they spent unblocking two juniors. You'll see it in the analysts' utilization a week later.
Principal / Senior Director — target 40–60%. Here the asset stops being their hours and becomes their leverage. A principal billing 85% is a five-alarm fire dressed as productivity: it means expansion revenue, reusable IP, and the next engagement's scope are all on hold while they grind delivery. Below 30%, though, and they've quietly drifted into overhead. The band is wide because this tier is a portfolio bet, not a timesheet.
Partner / VP — target 20–35%. Their real "utilization" is the pipeline, the pricing, and the firm they're building. Bill them only on the engagements where their name is the reason the deal closed.
The payoff isn't theoretical. SPI's data shows firms operating at the top maturity level run roughly 28% higher EBITDA than peers — and the difference is almost never working more hours. It's realization: making sure the hour worked at each tier is the right hour to bill.
Run the Variance Report Monday
You don't need new software to act on this. You need to stop reporting one number. Pull last quarter's hours and split utilization into the four tiers above. Then read the shape, not the average:
- Analysts low, principals high? You have a delegation failure, not a demand failure. Your most expensive people are doing work an analyst could bill at a fraction of the cost. Find the three deliverables your principals touched last month that an analyst could have owned with a checklist, and move them.
- Analysts high, principals also high? You're selling faster than you're building leverage. Margin looks great this quarter and the pipeline goes quiet in two. Protect principal time before you book the next deal.
- Everyone clustered at the same number? Your timesheet codes are too coarse to tell the truth. That flatness is hiding the inversion, not proving health.
Two guardrails as you do it. First, build the financial model on a blended 70–72%, not 100% — chasing full utilization guarantees burnout and kills the unbilled hours that create next year's revenue. If the firm can't clear margin at 72%, the problem is pricing and revenue architecture, not effort. Second, hunt the gray time that drags every tier down at once: the repeated "how do we do this?" interruptions that undocumented tribal knowledge creates. Those don't show up on any single role's number — they show up on all of them.
Manage the curve, and utilization stops being a stick you wave at tired people. It becomes the cleanest forward indicator of margin you have. For how a sub-70% rate compounds into valuation drag at exit, see what 68.9% utilization does to EBITDA.