
The practical answer
- Short answer
- Compare 2026 B2B sales ramp benchmarks by SMB, mid-market, enterprise, ACV, and quota. See when ramp time becomes a CAC payback problem.
- Best fit
- Industry: B2B SaaS/Services. Function: Sales
- Operating path
- GTM Execution → Commercial Performance → Performance Improvement
- Key metric
- 5.7 Months Average SaaS Sales Rep Ramp Time (2025)
The $100,000 "Ghost" on Your P&L
If you are a Founder looking at your sales forecast, you are likely staring at a lie. You see "Headcount: 4" and assume "Capacity: 4." But if those reps were hired in the last six months, your actual capacity is closer to 1.5.
Ramp time is the silent killer of Series B growth. It is the invisible latency between signing an offer letter and banking a check. And in 2026, that latency is getting worse, not better.
New data indicates the average B2B sales ramp time has ballooned to 5.7 months—a 32% increase since 2020. For a rep with a $120,000 base salary, that is nearly $60,000 in direct cash burn before they are consistently covering their own cost, let alone contributing to EBITDA. When you factor in recruiting fees, training costs, and burden, the fully loaded cost of a "ramping" rep often exceeds $100,000 before they close their third deal.
The Founder's Blind Spot
For founders, this metric is particularly frustrating. You (the founder) didn't need a ramp period. You knew the product, the pain, and the pitch from Day 1. You assume a smart hire should figure it out in 60 days.
They won't. Without the decades of context you carry in your head—tribal knowledge that hasn't been documented—new reps are lacking operating visibility. They aren't just learning your product; they are trying to decode your intuition. This gap between Founder Speed and Rep Reality is where missed quarters happen.
To fix this, we must move from "gut feel" expectations to hard benchmarks.
If you budget for revenue in Month 4 and it doesn't arrive until Month 7, your burn multiple spikes. The difference between a 9-month ramp and a 5-month ramp isn't the rep—it's the system.
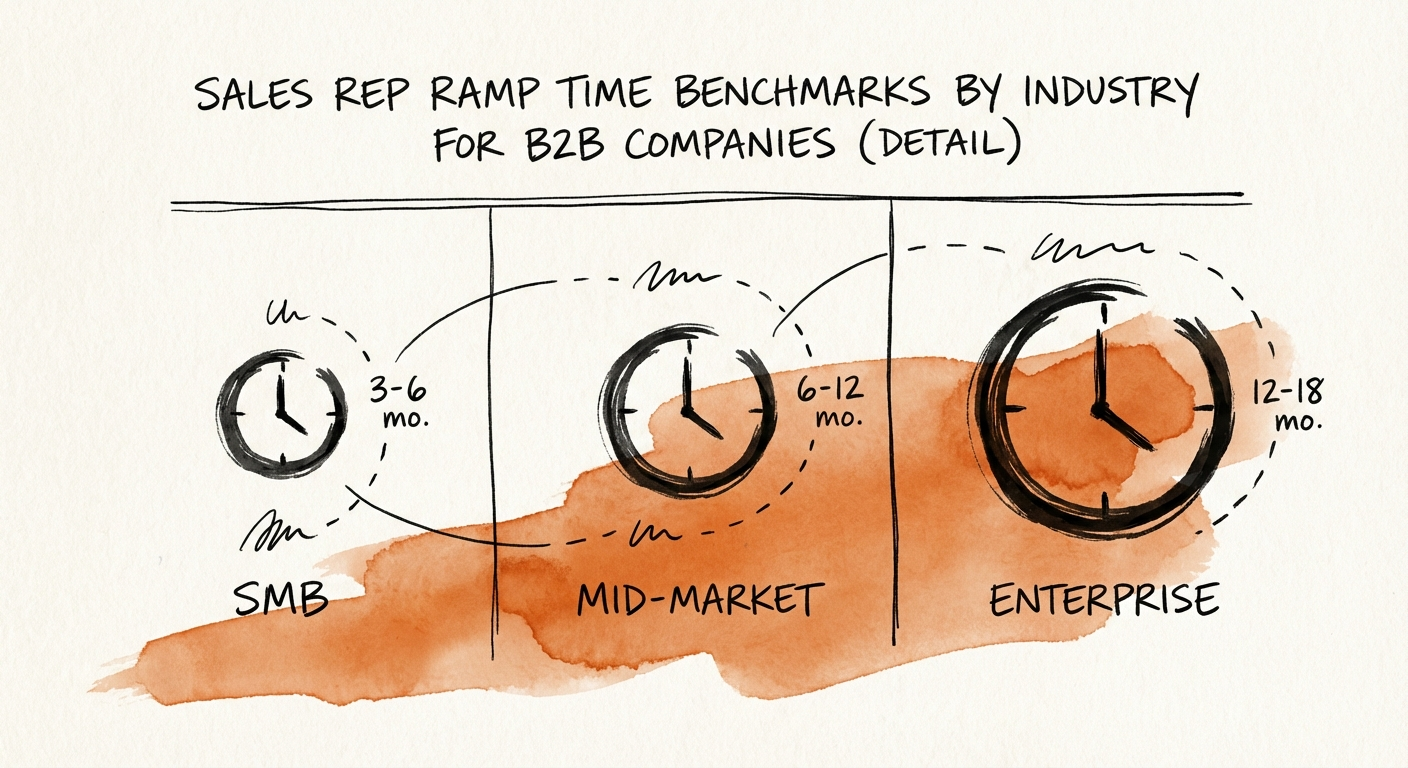
2026 Ramp Time Benchmarks by Segment
Ramp time is not a flat number; it is a function of deal complexity, buyer persona, and sales cycle length. A rep selling a $5,000 transactional tool should ramp in weeks; a rep selling a $250,000 digital transformation package needs quarters.
According to the latest data from The Bridge Group and other industry benchmarks, here is where your team should land.
1. The Transactional / SMB Tier
- Average Deal Size (ACV): <$10k
- Sales Cycle: <30 Days
- Target Ramp Time: 1–3 Months
- The Reality: If your reps aren't closing by Month 2 here, you have a hiring problem, not a training problem. These products should be "see it, get it, buy it."
2. The Mid-Market Tier
- Average Deal Size (ACV): $10k – $50k
- Sales Cycle: 2–4 Months
- Target Ramp Time: 4–6 Months
- The Reality: This is the danger zone for "founder." You expect 3 months; the market average is pushing 5.7. This misalignment wrecks forecasts. If you budget for revenue in Month 4 and it doesn't arrive until Month 7, your burn multiple spikes.
3. The Enterprise Tier
- Average Deal Size (ACV): $100k+
- Sales Cycle: 6–12 Months
- Target Ramp Time: 9–12+ Months
- The Reality: Enterprise reps are an investment, not a quick fix. With ramp times exceeding 9 months, you are betting a year of salary on future performance. Note: The average tenure of a sales rep is only 1.8 years. If they take 12 months to ramp, you only get 9 months of peak productivity before they likely churn.
The Productivity Calculation
How do you define "Ramped"? Stop using feelings. Unpredictable sales forecasting often stems from undefined ramp stages. A rep is ramped when they hit:
- 100% of Quota for 3 rolling months, OR
- Fully Weighted Pipeline Coverage (3x-4x) consistently.
Until then, they are a liability, not an asset.
Compressing the Ramp: From 9 Months to 5
You cannot change the market, but you can change your physics. The difference between a 9-month ramp and a 5-month ramp isn't the quality of the rep—it's the quality of the system.
1. Document the "Founder Brain"
Your "genius" is unscalable. Stop selling your genius and start selling your system. If your onboarding consists of "shadowing me for two weeks," you are failing. Shadowing transmits bad habits and survivor bias. You need Playbooks: specific, script-level documentation on objection handling, discovery questions, and demo flows.
2. Gate the Phone
Do not let a rep touch a lead until they have passed a "Gate." A Gate is a role-play certification where they must pitch you (or a manager) and score above a 90%. If they fail, they study and re-test. It is cheaper to keep them in training for an extra week than to let them burn 50 leads learning on the job.
3. The "First Five" Rule
Ramp is not linear; it's exponential. The fastest way to ramp is to force early wins. Manufacture the "First Five" deals. Hand them smaller, warmer, or easier accounts to close in their first 60 days. The confidence momentum from early checks creates a psychological ramp that training alone cannot match.
4. Measure Leading Indicators, Not Lagging Revenue
If you wait for closed-won revenue to measure ramp, you will be waiting 6 months to find out you made a mis-hire. Measure activity velocity: Are they making as many calls as a veteran? Are they setting as many meetings? If the activity ramp is flat, the revenue ramp will never happen.
Conclusion
A 5.7-month average is not a permission slip to accept mediocrity. It is a benchmark to beat. In a capital-constrained environment, the company that ramps reps fastest wins on unit economics. Systems, not heroics, will get you there.