
The practical answer
- Short answer
- CAC payback benchmarks for Series B SaaS: top quartile under 10 months, median 15, danger past 22, and the 110% NRR that keeps payback from being fatal.
- Best fit
- Industry: SaaS. Function: Go-To-Market / Finance
- Operating path
- Unit Economics → Commercial Performance → Transaction Advisory Services
- Key metric
- Under 10 mo Top-quartile CAC payback target
The Era of Efficiency Over Velocity
For a decade, Series B signaled a license to burn. The playbook was simple: raise $30M+, pour fuel on the sales fire, and worry about unit economics at Series C. That era is dead.
In the current capital environment, CAC Payback Period has dethroned year-over-year growth as the primary signal of a healthy Go-To-Market (GTM) engine. Investors are no longer underwriting 40% growth if it comes with a 24-month payback anchor. They are looking for the "Efficient Growth" profile—companies that can scale without requiring a capital injection every 18 months.
For the Series B founder-CEO, this metric is the ultimate diagnostic. It tells you exactly how fast your revenue engine refills your cash tank. If your payback period drifts beyond 18 months, you aren't just growing inefficiently; you are actively increasing your burn multiple with every new customer you sign.
CAC payback is the most honest number on your dashboard. It tells you exactly how fast your revenue engine refills the tank, and whether you control your destiny or your next raise does.
The Data: Series B Payback Benchmarks (2024-2025)
We analyzed data from major industry reports, including OpenView, ICONIQ Growth, and Meritech, specifically isolating the $10M to $30M ARR cohort (Series B). The widening gap between "average" and "elite" reveals where capital is flowing.
The Benchmark Breakdown
- Top Quartile (Best-in-Class): < 10 Months
- Median (The Standard): 15 Months
- Bottom Quartile (Danger Zone): > 22 Months
While the median sits at 15 months, top-performing firms are recovering acquisition costs in under a year. This speed of capital recycling allows them to reinvest in growth twice as fast as their median peers without additional dilution.
The Hidden Correlation: Retention & Payback
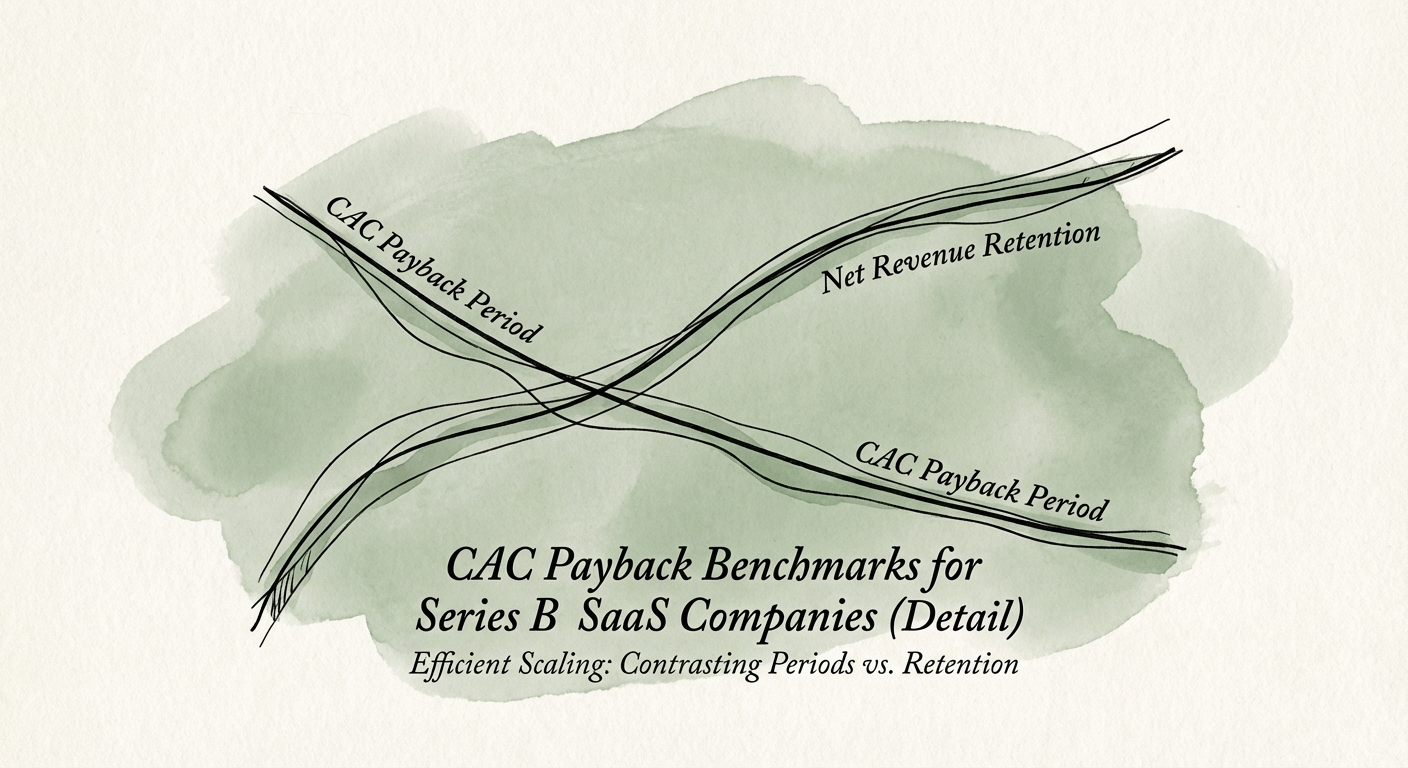
Data from SaaS Capital highlights a critical nuance: payback is meaningless if the customer churns before the breakeven point. For Series B firms, Net Revenue Retention (NRR) must exceed 110% for a 15-month payback to be sustainable. If your NRR is below 100%, a 15-month payback is mathematically fatal.
Diagnostic Action Plan: Optimize or Burn?
If your dashboard shows a CAC Payback above 18 months, you do not have a growth problem; you have a friction problem. Before hiring another AE, execute this diagnostic audit:
1. Segment Payback by Channel
A blended 18-month payback often hides a healthy 9-month inbound motion diluted by a toxic 30-month outbound motion. Kill the channels that drag your average down. As noted in OpenView's 2023 Benchmarks, efficient growth comes from ruthless channel prioritization, not broad expansion.
2. Gross Margin Impact
Remember that CAC Payback is calculated on Gross Margin, not Revenue. If your professional services or server costs are bloating COGS, your payback period extends automatically. A 10% improvement in Gross Margin can shave 2-3 months off your payback period without a single change to sales efficacy.
3. The Pricing Lever
The fastest way to compress payback is not lowering CAC, but raising ACV (Annual Contract Value). Series B is the prime window to test value-based pricing. A 20% price increase drops a 15-month payback to 12.5 months instantly.
Conclusion
Efficiency is not about cutting costs; it is about the velocity of capital returns. Aim for the 12-month gold standard to control your own destiny.