The practical answer
- Short answer
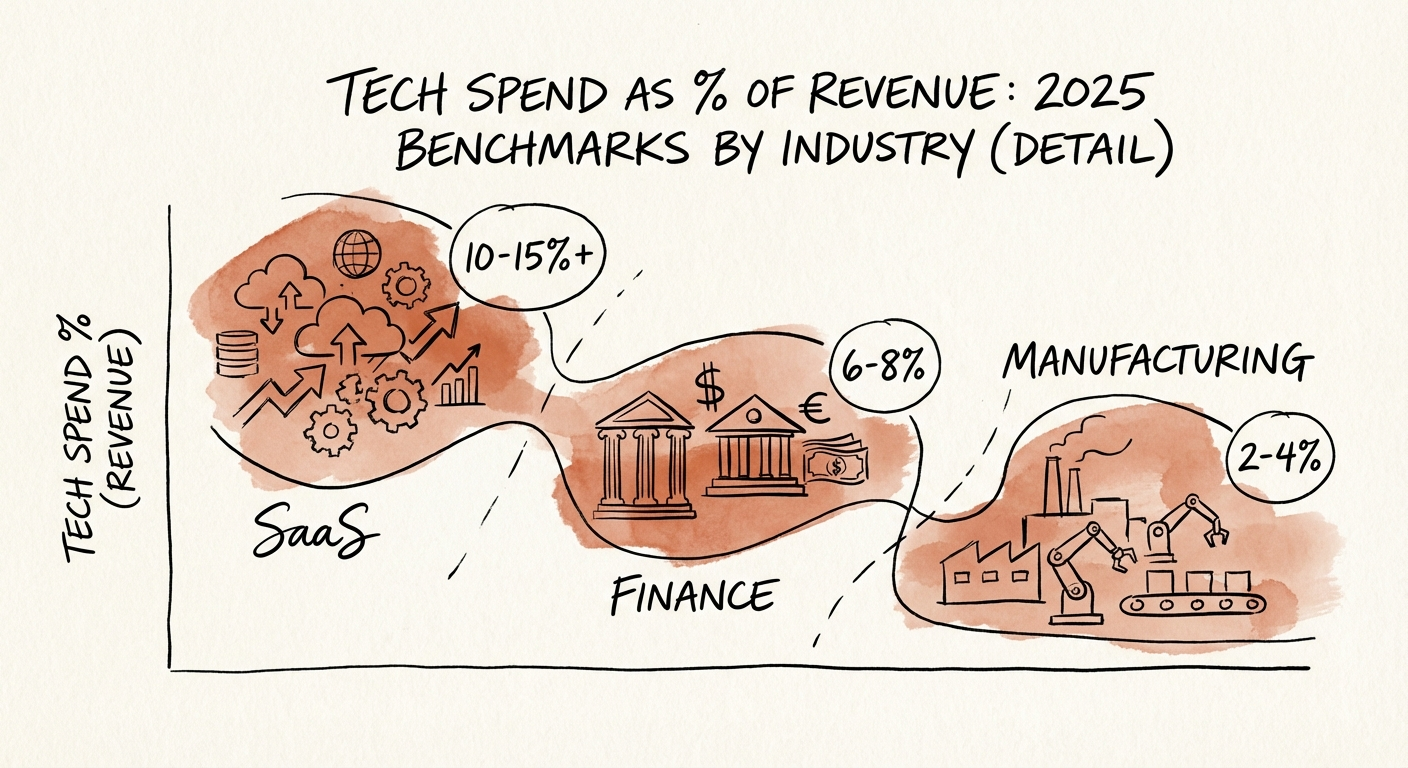
- SaaS runs 12–18% of revenue on IT; manufacturers 1.5–3%; the same 4% means opposite things. The 2025 by-sector benchmarks — and the 56% maintenance trap.
- Best fit
- Industry: Cross-Industry. Function: Office of the CFO
- Operating path
- Financial Infrastructure → Commercial Performance → Valuations
- Key metric
- 56% of IT budgets consumed by 'Maintenance' and Operations
Two portfolio companies, both at 4%, opposite verdicts
A $50M SaaS company spending 4% of revenue on technology is quietly starving its own product. A $50M industrial distributor spending 4% is probably bleeding cash on a botched ERP rollout. Same number, same revenue, and you should react with relief in one case and alarm in the other. That is the trap with "IT as a percent of revenue": the headline figure tells you almost nothing until you know what kind of asset you are looking at.
This is the metric operating partners reach for first because it is the easiest to pull from a budget line. It is also the one most likely to mislead a deal team. The cross-industry average floats somewhere in the low single digits, but averaging a hospital network, a marketing agency, and a logistics platform produces a number that describes none of them. Take that average into a board meeting for a vertical SaaS portfolio company and you will spend the next twenty minutes explaining why you are "wrong."
Two things determine whether a given percentage is healthy: the industry the asset operates in, and the share of that spend that keeps the lights on versus the share that builds something. Gartner's outlook for 2025 has global IT spend climbing roughly 9% past the $5 trillion mark, and most of that increase is AI infrastructure repricing and seat-based SaaS creeping into cloud bills. So even a company that changes nothing will see its percentage drift upward. If you are reading the raw number year over year without decomposing it, you will mistake vendor inflation for investment.
The uncomfortable part shows up in diligence. Deloitte's work on tech finance puts the share of the typical IT budget consumed by maintenance and operations near 56%. More than half the check is being written just to prevent things from breaking. A buyer's diligence team will find that ratio in a week, and they will price it. Knowing it before they do is the difference between leading the narrative and reacting to it.
A buyer never asks how much you spend on IT. They ask how much of it would disappear if you stopped trying to grow. That ratio sets your multiple, not the percentage.
What "normal" actually looks like, by sector
Stop benchmarking your asset against the S&P 500 or against a cross-industry mean. Benchmark it against companies a buyer would put it next to in a comp set. Here is where mid-market ranges actually land in 2025, and more importantly, what a number outside the range is telling you.
Software and SaaS: technology is the product, not overhead
Expect 12% to 18% of revenue, and read it as cost of goods plus R&D rather than IT support. The danger here is the company spending too little. A SaaS business at 4% is not efficient; it is deferring engineering and accruing technical debt that a technical buyer will discount the offer for. The question is not the total, it is whether the spend buys idle cloud capacity or shipped features.
Financial services and FinTech: the compliance floor
Plan on 8% to 12%, with a hard floor set by security and regulatory load. This is not a category where you defer SOC 2 to flatter a quarter. The trap is the legacy core that traps the whole budget in maintenance; the top-quartile operators get this toward 7% by retiring the core, not by cutting headcount around it.
Manufacturing and distribution: thin margins, ERP gravity
The healthy range is roughly 1.5% to 3%, anchored by ERP and supply-chain visibility. When you see a manufacturer above 3%, it is almost never strategic investment. It is a stalled ERP implementation in its second year of "almost live," quietly eating cash with no go-live date a buyer would believe.
Professional services and healthcare admin: a utilization game
Figure 4% to 6%, with the dollars steered toward automation and billable throughput. The tell is high spend paired with utilization under 70% — the technology is being purchased but not converted into billable capacity.
The ratio a sharp buyer actually asks for
Total percentage is a blunt instrument. The decomposition that matters is how the spend splits between keeping operations running and building new capability. A distressed asset runs about 80% maintenance, 20% growth — the IT team is a glorified help desk. A stable performer sits near 60/40. An exit-ready company that has automated its infrastructure can push toward 45% maintenance, 55% growth, which means budget flows to the roadmap instead of to firefighting. When a buyer asks "what happens to your IT spend if you stop investing in growth," they are probing this exact split.
What to do before you approve the next budget
You do not fix a misshapen IT budget with a 10% across-the-board cut. That is how you trigger an outage in the middle of diligence and hand the buyer a reason to retrade. You fix it by changing what the money buys.
Find the spend nobody approved
Run a SaaS discovery scan before you sign off on the next budget cycle. Flexera's 2025 State of the Cloud work points to how much SaaS lives outside what IT formally tracks — and in mid-market portfolio companies that usually means three or four overlapping tools doing the same job, bought department by department. Say you find Asana, Jira, and Trello all live across three teams. Consolidating them recovers real dollars, but the larger win is forcing the cross-functional alignment that the duplication was papering over.
Pay down the maintenance tax, deliberately
Ask why maintenance is eating half the budget. Usually it is people manually nursing systems that should patch and scale themselves. A one-time automation investment frequently beats a recurring headcount line: hypothetically, spending in the low six figures to automate a manual patching and provisioning process can retire a comparable annual run-rate cost permanently. That is a maintenance-to-growth shift, and it shows up directly in normalized EBITDA.
Build the add-back story while you can still document it
At sale, a buyer's quality-of-earnings team will scrutinize every adjustment. If you can demonstrate that a meaningful slice of recent IT spend was genuinely one-time — a cloud migration, an ERP cutover — rather than recurring maintenance, much of it can support an EBITDA add-back. But "we think it was one-time" loses every argument. You need the cost classification and governance in place a year before the process starts, not assembled in a data room under deadline.
The objective was never to spend less on technology. It is to spend in a shape a buyer will pay for. A company at 10% of revenue with a balanced maintenance-to-growth split is a platform someone will compete to own. A company at 3% with almost everything going to keep-the-lights-on is a company whose run-rate only goes one direction once the deferred work comes due — and that bill always arrives in the data room. The percentage was never the point — what it funds is.