The practical answer
- Short answer
- A SaaS founder's bookings and deferred revenue don't tie out in the board meeting. Here's why your CRM and GL disagree, and the cadence fix that rebuilds trust.
- Best fit
- Industry: B2B Tech / SaaS. Function: Office of the CFO
- Operating path
- Financial Infrastructure → Commercial Performance → Valuations
- Key metric
- 27% CFOs who completely trust their own data (RGP 2025)
The drill-down that ends careers in 30 seconds
You're three slides into the Q3 deck. Bookings forecast: $2M for July. The operating partner from your lead investor doesn't even look up from the page. "Your bookings show two million for July, but deferred revenue only moved $500K. Walk me through the gap." Eight people are now watching you, not the slide.
If you can answer that in the room — multi-year prepays, ramped deals, a chunk of usage-based revenue that never hits deferred — you keep the meeting. If you say "let me confirm those figures and circle back," the meeting is effectively over. Not because the number was wrong. Because you didn't know your own number well enough to defend it live. The board's mental model of you just shifted from "operator who runs the business" to "founder who reads reports someone else built."
Here's the part founders miss: that variance was never the problem. A $1.5M gap between bookings and deferred revenue is often completely legitimate in a SaaS model. The problem is that you couldn't say so instantly, with conviction, because nobody on your team actually reconciles those two systems before the deck ships. You found out the answer the same time the board did.
This is rarely a competence issue. You can have a sharp controller and a closer of a VP Sales and still produce a deck nobody trusts — because the trust gap lives in the seams between systems, not in any one person's work. You're not an outlier here, either. In a 2025 RGP survey, only 27% of CFOs reported complete trust in the quality of their own data. When the person who signs off on the numbers privately doesn't believe them, a board with no operational visibility has zero reason to.
The board didn't lose faith over the $1.5M variance. They lost it the second you admitted you didn't know the gap was there.
Your "single source of truth" is a spreadsheet named final_v7_USE-THIS
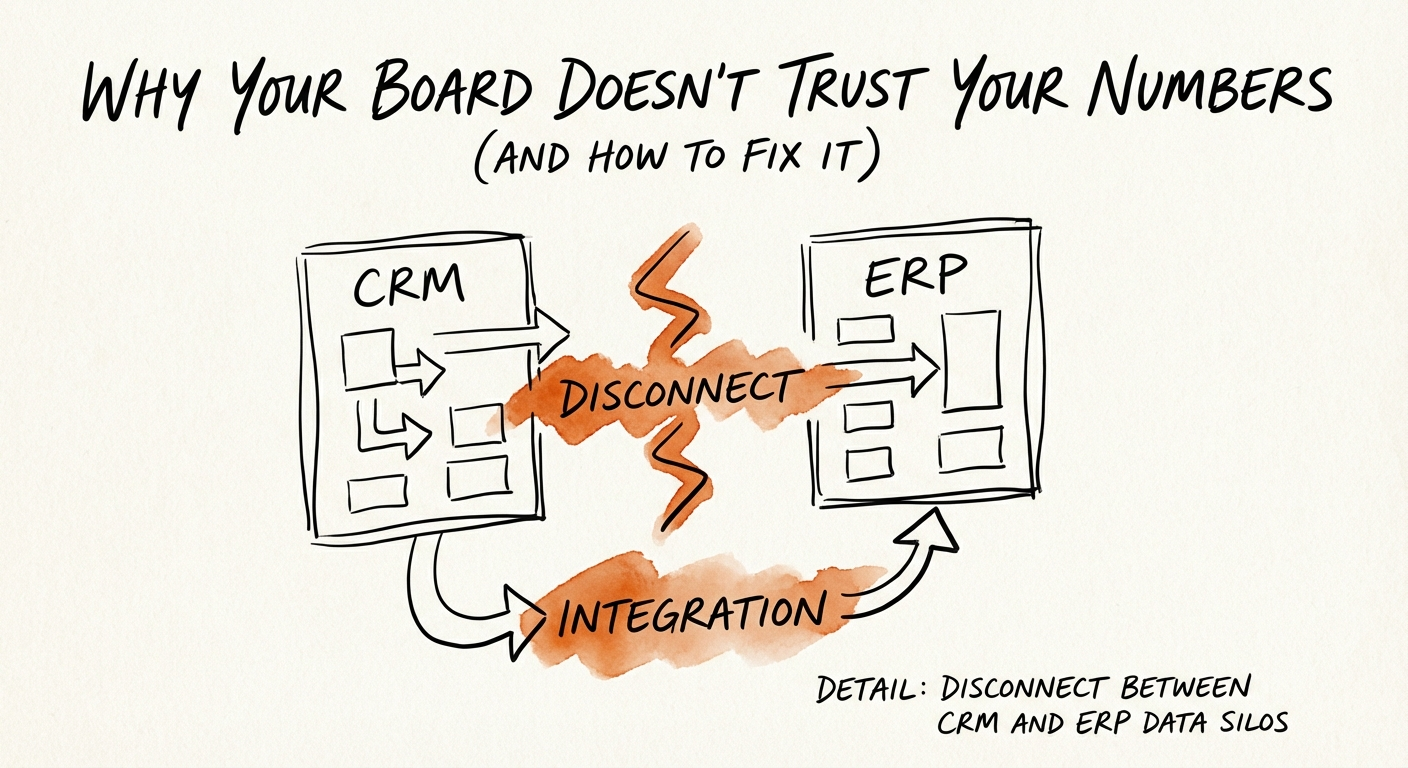
At most Series B and C SaaS companies, the source of truth isn't NetSuite or Salesforce. It's a fragile chain of Excel tabs that a senior analyst manually stitches together every month to bridge two systems that were built to disagree.
Your CRM is forward-looking and optimistic by design — it counts intent, pipeline, and "closed-won" the moment a rep flips a stage. Your general ledger is backward-looking and conservative by law — it counts revenue only as you earn it. So when Sales reports $2M booked and Finance reports $500K of deferred movement, both are telling the truth in their own dialect, and the translation between them happens by hand, at night, under deadline. That's where errors are born. Vena Solutions found that FP&A teams spend 75% of their time gathering and cleaning data and only 25% analyzing it — meaning the people you pay to think about the business spend three-quarters of their hours moving numbers between tabs.
The second silent killer is definitional. Ask your VP Sales, your controller, and your head of CS what "ARR" means, and you'll get three answers: signed contract value, live and invoiced revenue, and net-of-churn run rate. Each is defensible. None of them match. So when your deck shows one ARR figure and a board member's portfolio dashboard shows another, the board doesn't conclude one source is wrong — they conclude both are, and they start re-deriving your business from scratch. That same definitional fog wrecks the forecast: when bookings, billings, and revenue can't be reconciled by machine, you fall back on human judgment, and humans round up. Xactly's 2024 benchmark found only 20% of sales organizations forecast within 5% of actuals. For a SaaS company between rounds, a 10% miss isn't a rounding error — it's the line between extending runway and a panicked bridge.
Three tells that your board reporting is held together with tape:
- The deck gets finished at 2 AM the night before the meeting, every time.
- You have three "churn" numbers in three spreadsheets and no agreed answer for which is right.
- "What's our blended CAC?" triggers a 48-hour fire drill instead of a sentence.
You engineer out of this — you don't hire out of it
Throwing another junior analyst at a reconciliation problem just adds a fourth spreadsheet. Rebuilding board trust is an infrastructure job, and it has a specific order of operations.
1. Settle the language before you touch a tool
Write a one-page data dictionary that gives ARR, GRR, NRR, CAC, and gross margin a single mathematical definition — the exact formula, the source system, and which deals count. Get Sales, Finance, and CS to sign it. This kills the "tribal knowledge" problem where the answer depends on who ran the report; the same undocumented-process tax shows up across the org, which is why tribal knowledge quietly bleeds EBITDA. Until the definitions are frozen, every system you buy just automates the disagreement faster.
2. Automate the reconciliation seam, not the reporting
Stop using Excel as a database that pretends to be a pipe. Put a sync layer between CRM and GL so "closed-won" can't be saved without the billing terms, contract length, and start date a finance system needs to recognize revenue correctly. That's how the bookings-to-deferred gap becomes explainable in the room instead of discovered in the room. The cost of skipping this is real money: Gartner estimates poor data quality costs organizations an average of $12.9 million a year.
3. Ship a Friday flash and kill the quarterly ambush
The reason the board interrogates you is information starvation between meetings. Cure it with a one-page flash report every Friday: pipeline coverage, new logos, cash balance and runway, and net churn risk — five numbers, no commentary. When the board watches the trend roll in weekly, the quarterly meeting stops being a courtroom and becomes a strategy conversation, because there's no surprise left to spring.
Trust isn't built on a good quarter — it's built on the day you field the deferred-revenue drill-down in real time, with figures that tie out across every system, and watch the room relax. That's the moment you stop being a promising founder and become an investable operator. If your numbers still come from gut feel and late-night spreadsheets, start with fixing broken sales forecasting, and pressure-test the deck itself against a SaaS board reporting framework before the next meeting.