The practical answer
- Short answer
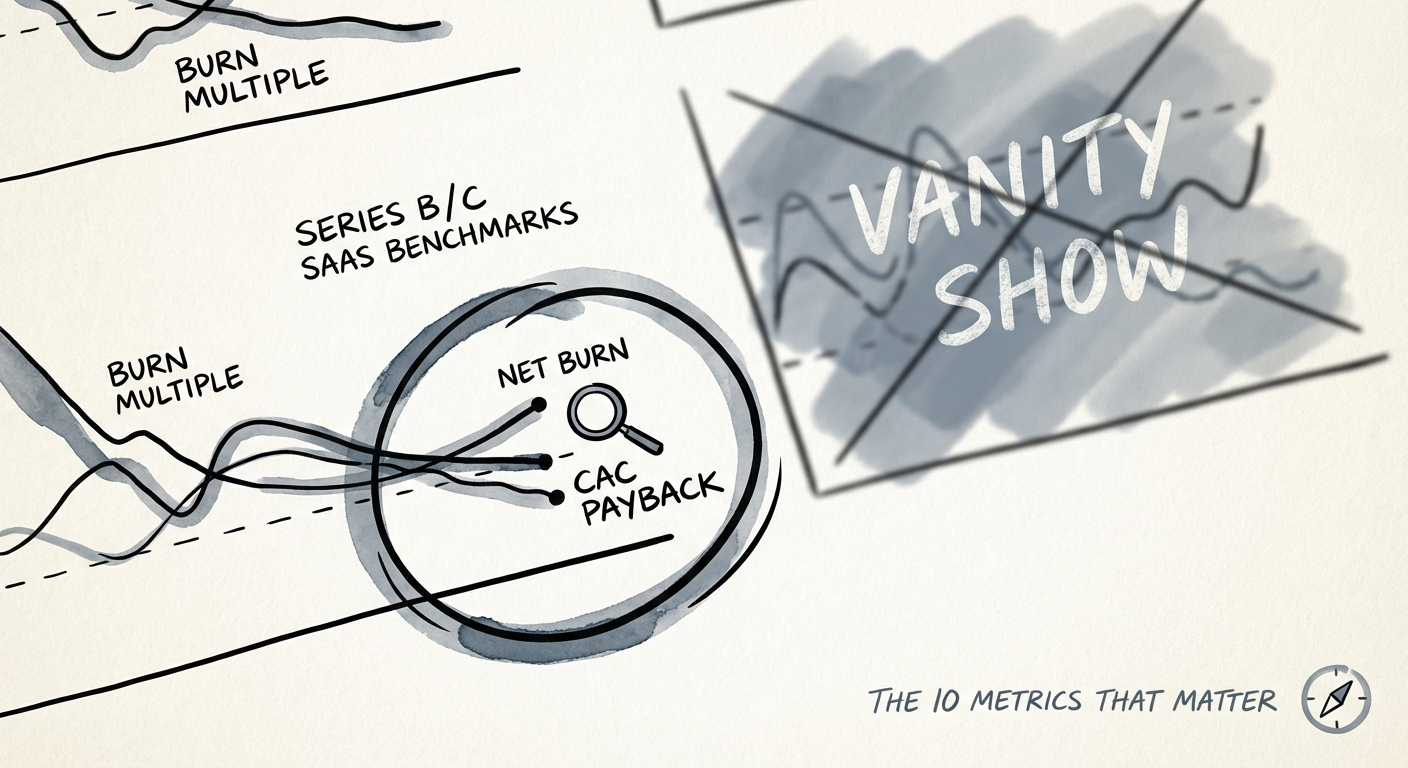
- Stop presenting vanity metrics. Here are the 10 board reporting metrics that actually matter for Series B/C SaaS in 2026, including Burn Multiple and NRR benchmarks.
- Best fit
- Industry: SaaS. Function: Finance
- Operating path
- Financial Infrastructure → Commercial Performance → Valuations
- Key metric
- 1.5x Max Burn Multiple for Series B
The Boardroom is Not a Theater
Most board decks are works of fiction. Not because the numbers are fake, but because they are curated to tell a story of inevitable success while hiding the structural rot underneath. I see it constantly: cumulative revenue charts that always go up and to the right, "blended" CAC numbers that hide a disastrous enterprise expansion, and pipeline coverage ratios based on fantasy close rates.
If you are a Founder or a CFO at a Series B or C company, the game has changed. The era of "growth at all costs" is dead and buried. In 2026, your board doesn't just want to see top-line growth; they want to see efficient growth. They are looking for the math that determines your runway and the unit economics that prove you can scale without lighting cash on fire.
The Shift to Radical Transparency
When you present "vanity metrics"—like total registered users instead of active users, or blended churn instead of gross revenue retention—you aren't fooling your investors. You are signaling that you either don't understand the levers of your own business, or you're too afraid to show them. Both are board-level trust problems.
The 10 metrics below are not designed to make you look good. They are designed to tell the truth. They are the diagnostic tools that allow you to fix problems before they become board-level crises. If your current dashboard doesn't have these, you lack the operating visibility to steer.
Your board doesn't need you to be perfect. They need you to be in control. When you present the hard metrics—bad news and all—you demonstrate that you are the operator they invested in.
The Efficiency & Economics Block
1. Burn Multiple
Forget simple burn rate. The Burn Multiple is the definitive efficiency metric for 2026. It answers a simple question: How much cash are we burning to generate each new dollar of ARR?
The Formula: Net Burn / Net New ARR
- Best-in-Class: < 1.0x
- Good (Series B Target): 1.0x – 1.5x
- Concerning: > 2.0x
If your Burn Multiple is above 2.0x, you aren't scaling; you're bloating. Investors today expect a multiple under 1.5x for Series B companies. This metric strips away the noise and forces you to confront operational inefficiency.
2. CAC Payback Period (Segmented)
A "blended" CAC payback of 12 months often hides a terrible secret: your SMB segment pays back in 6 months, but your new Enterprise segment is taking 36 months. You must report this segmented by customer type.
Benchmarks (2025 Data):
- SMB: Target < 12 months.
- Mid-Market: Target 12–15 months.
- Enterprise: Target 18–24 months (acceptable due to lower churn).
According to ScaleXP's 2025 benchmarks, top-quartile companies are achieving payback in under 9 months by rigorously qualifying leads before expensive sales resources touch them. If your payback is creeping up, stop hiring sales reps and fix your unit economics.
3. Net Revenue Retention (NRR)
This is your valuation multiplier. NRR measures how much your revenue grows from the existing customer base, accounting for churn, contraction, and expansion. It proves product-market fit better than any sales chart.
The Benchmark: The median NRR for private B2B SaaS has dipped to roughly 102-106% in 2025 due to budget scrutiny. However, top performers are still hitting 120%+. If you are below 100%, you have a leaky bucket that no amount of new sales can fix.
4. Gross Revenue Retention (GRR)
While NRR can mask a churn problem with strong upsells, GRR tells the brutal truth about retention. It maxes out at 100%. If your GRR is below 85%, you don't have a growth problem; you have a product or onboarding problem.
The Operational Health Block
5. Weighted Rule of 40
The standard Rule of 40 (Growth % + Profit %) is often too crude for Series B companies investing heavily. The Weighted Rule of 40 (often 2x Growth + Profit) better reflects the stage where growth is the primary directive but shouldn't come at suicidal burn.
The Reality Check: Public SaaS medians for the Rule of 40 have dropped to around 12-15% in 2025. Only the elite are crossing the 40% threshold. If you are crossing it, you command a premium valuation (often 12x+ revenue vs. 6x for the median).
6. True Gross Margin (Subscription vs. Services)
Never blend your subscription margin with your professional services margin. Your subscription gross margin should be 75-85%. Your services margin should be positive (20%+), but its purpose is to drive adoption, not profit. If your subscription margin is below 70%, you are likely over-customizing your product or have inefficient cloud infrastructure.
7. Pipeline Coverage (AI-Weighted)
Stop reporting "3x coverage." It means nothing if 50% of that pipeline is fluff. Use AI-Weighted Pipeline Coverage, which applies historical win rates by stage and deal size to your current funnel. A $1M pipeline with a 10% historical close rate is worth $100k, not $300k. Board members want to see the likely outcome, not the hopeful one.
The 'Sleep at Night' Metrics
8. Zero-Revenue Cash Runway
Most runway calculations assume revenue keeps coming in. That's optimistic. I advise CFOs to track Zero-Revenue Runway: If sales stopped tomorrow, how many months until we die? This is your absolute worst-case scenario buffer. It forces you to look at your fixed costs with a critical eye. If this number is under 6 months, you are in the danger zone.
9. Revenue Per Employee (ARR/FTE)
Headcount is likely 70% of your OPEX. Are you getting leverage? The benchmark for a healthy Series B/C SaaS company is approaching $200,000 ARR per employee. If you are at $100,000 and hiring more people, you are scaling inefficiency. Revenue per employee is the quickest way to spot bloat in middle management.
10. The Magic Number
The SaaS Magic Number measures sales efficiency: (Current Quarter ARR - Previous Quarter ARR) * 4 / Previous Quarter Sales & Marketing Spend.
- > 1.0: You are efficient. Pour more fuel on the fire.
- 0.75 - 1.0: Caution. Optimize before scaling.
- < 0.75: Stop. Something is broken in your sales motion.
Do not ask the board for more sales hires if your Magic Number is 0.6. You will only burn cash faster.
Action Plan: The 3-Slide Board Deck
Your next board meeting shouldn't be a 50-slide odyssey. It needs to be a focused diagnostic.
- Slide 1: The Health Check. Burn Multiple, Cash Runway, NRR, GRR. Green/Red status only.
- Slide 2: The Growth Engine. CAC Payback (Segmented), Magic Number, Weighted Pipeline.
- Slide 3: The Strategic Levers. What are you doing to fix the Red metrics from Slide 1?
Your board doesn't need you to be perfect. They need you to be in control. When you present these metrics—bad news and all—you demonstrate that you are the operator they invested in. You shift the conversation from "Why did we miss?" to "Here is exactly how we are fixing it."
Transparency builds trust faster than growth. Start tracking the hard numbers today.