The practical answer
- Short answer
- FinTech enterprise CAC hit $14,774 in 2025 — 10x its SMB number. Vertical and channel benchmarks that explain why your CAC jumped 60% since 2020.
- Best fit
- Industry: B2B SaaS. Function: Go-to-Market
- Operating path
- Unit Economics → Commercial Performance → Transaction Advisory Services
- Key metric
- ~23 Months Median CAC Payback Period (Private SaaS)
The same revenue costs 60% more than it did in 2020
Pull up the deal you closed in the first quarter of 2020 — a mid-market customer, clean fit, signed in six weeks. Now price out winning that exact same logo today. Across B2B SaaS, the answer is roughly 60% more, according to First Page Sage's 2025 acquisition-cost data. You are running the same motion, signing the same buyer, and paying an "acquisition tax" that didn't exist when capital was free.
Here is the part that ends careers, though: the tax isn't distributed evenly, and the blended number on your board deck hides exactly where it's hitting. I have watched this exact thing happen in a Series B diligence room — the deck shows a tidy blended CAC near $500, and an investor's analyst spends forty minutes pulling it apart until the truth falls out: referrals and a legacy organic channel were quietly carrying a paid-search line costing around $2,000 per customer. The company had been doubling its paid budget for three quarters and watching net-new logos stay flat. It wasn't buying growth. It was buying the privilege of saying the word "growth" on the next earnings call.
Averages lie because they're a weighted bet you didn't place on purpose
A blended CAC is just a weighted average, and the weights drift. When your cheap channels (referral, organic, a warm event list) make up most of your volume, they drag the blend down and disguise an expensive paid channel. The moment you try to scale — pour budget into the paid line because "CAC looks fine" — the mix shifts toward the expensive channel and the blend snaps upward. You doubled spend and didn't double leads. You doubled the cost of each lead. That's not a marketing miss; it's an arithmetic certainty that your board will eventually find before you do.
The fix starts with refusing to report one number. The benchmarks below are split the way your own dashboard should be: by vertical, by deal size, and by channel — because a FinTech infrastructure sale and a B2B commerce sale share a category label and almost nothing else.
A blended CAC of $500 looks healthy until you realize it's a $2,000 paid-search number wearing a referral channel's clothes. The board sees the average. The down round comes from the spread.
The 2025 numbers: where the tax actually lands
The single most useful thing you can do with vertical CAC data is stop comparing yourself to "B2B SaaS." Compare yourself to the buyer you actually sell to. Here's the 2025 spread between SMB (transactional) and enterprise (committee-driven) motions, drawn from the Optifai channel benchmarks and First Page Sage industry data:
- FinTech: SMB $1,461 → Enterprise $14,774. The 10x jump is the price of regulatory scrutiny and "we are moving money, prove you won't lose it" trust requirements. Every additional security questionnaire and compliance review is a billable hour your CAC absorbs.
- Cybersecurity: SMB $833 → Enterprise $10,226. You are bidding on the same keywords as forty other vendors who all promise to stop the breach. Auction dynamics, not your funnel, set the floor.
- EdTech / Higher Ed: SMB $849 → Enterprise $6,682. The cost driver isn't ad price — it's the procurement committee and the academic calendar that lets a deal sit dormant for a full semester.
- B2B eCommerce & Retail tech: SMB $299 → Enterprise $2,206. Low-friction, frequently product-led. This is the cheapest acquisition in the data set, which is exactly why everyone tries to bolt a PLG motion onto a FinTech sale and wonders why it doesn't transfer.
- General B2B SaaS: SMB ~$700 → Enterprise ~$4,500+.
Sit with the FinTech and eCommerce extremes for a second. The most expensive enterprise vertical costs nearly 7x the cheapest. If your investor deck benchmarks a FinTech infrastructure company against a "blended B2B SaaS" number, you are being graded on the wrong curve — in your favor if you sell commerce tools, brutally against you if you sell to banks.
Channel: the second tax nobody itemizes
Who you sell to sets the ceiling; where you spend sets the slope. The 2025 channel averages:
- LinkedIn Ads: ~$980. The most precise targeting in B2B, priced like it.
- Paid Search: ~$802. Fast, predictable, and stubbornly linear — every new customer costs about what the last one did.
- Email: ~$510. Still the quiet efficiency leader for mid-funnel nurture.
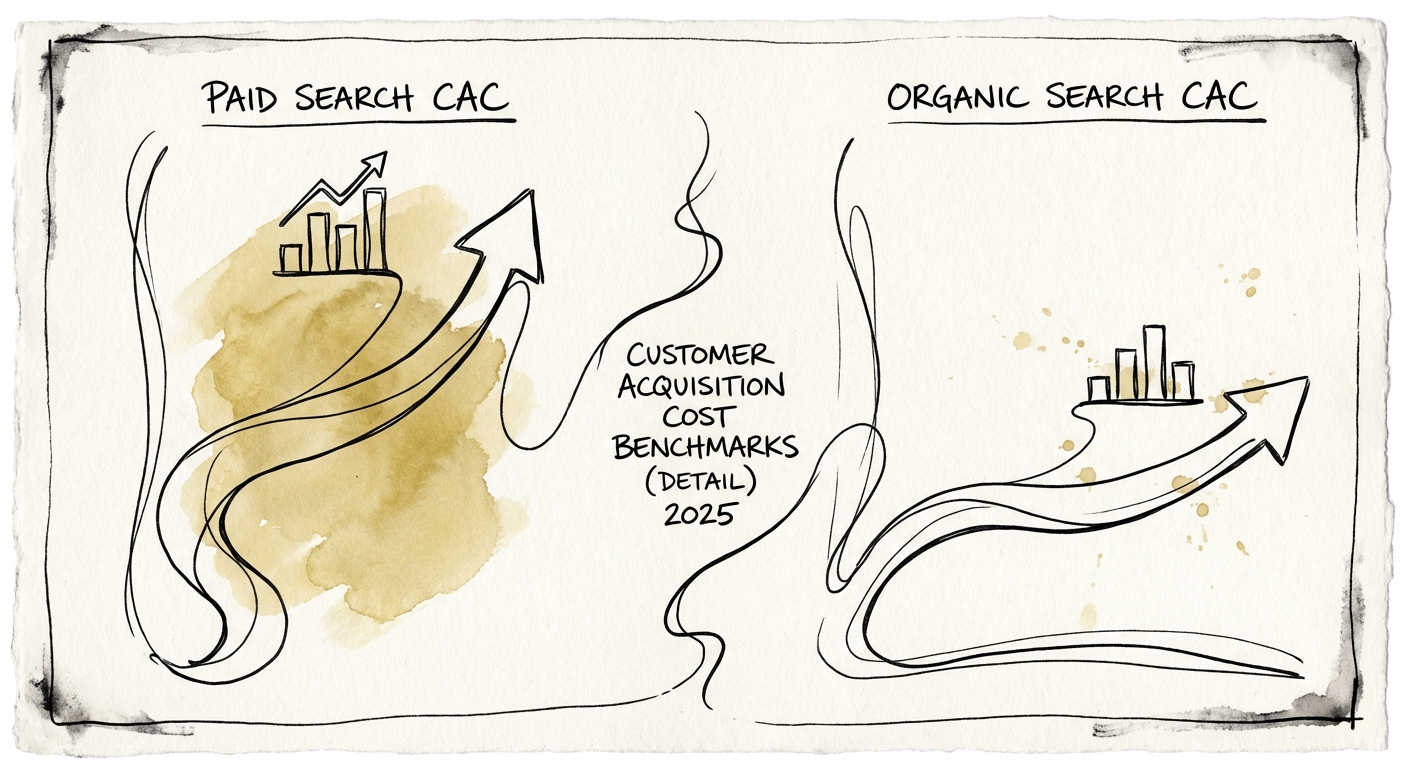
- Organic Search: ~$942 in year one, falling to ~$290 at maturity. Painful upfront, then the best unit economics in the table — if you survive the runway it takes to compound.
Notice that mature SEO at ~$290 beats paid search at ~$802 by nearly 3x — but only after a multi-quarter investment that shows up as cost before it shows up as customers. That timing gap is precisely why founders under board pressure keep choosing the expensive channel: it pays back this quarter. The two efficiency thresholds that translate all of this into valuation language are payback and leverage. Median CAC payback for private B2B SaaS is now ~23 months per the KeyBanc 2024 SaaS survey; cross 18 months and you're financing your customers' growth instead of your own. On the leverage side, 3:1 LTV:CAC is the floor — top-quartile operators push toward 5:1 by mining expansion revenue (NRR), raising LTV without paying a dime of new acquisition cost.
What to do Monday if your CAC is above the line
If your vertical number is running hot, more budget is the wrong lever — you have a mix problem, not a money problem. Three moves, in order.
1. Itemize the tax before your next board meeting
Build the one table your blended number is hiding: CAC by channel, with retention next to it. You're hunting for two profiles — the hero channel (low CAC, holds up at scale, customers stick) and the money pit (high CAC, weak retention, the leads churn before payback). Cut the bottom slice of spend feeding the money pit. Volume dips a little; efficiency moves a lot. Do this before diligence does it to you — the version of this story where a clean blend hides an expensive paid line tends to end in a re-priced round, and the re-price is the founder's surprise, not the investor's.
2. Buy assets, not rentals — but fund the gap honestly
Paid ads are rented growth: stop paying, leads stop. Organic, content, and owned email lists are assets that compound. The ~$290 mature-SEO CAC versus ~$802 paid-search CAC is the whole argument. The catch is the runway — organic is cost-first, customer-later. So don't flip the budget overnight. Shift incrementally and ringfence the paid channel that's actually working to fund the asset build. Telling your board "we're trading a quarter of paid efficiency to own a $290 channel in twelve months" is a defensible plan. Quietly starving pipeline is not.
3. If you sell FinTech or Cyber, attack the trust tax directly
That $14,774 FinTech enterprise number isn't mostly ad cost — it's the cost of convincing a skeptic who controls money or security to trust you. Every redundant piece of evidence you make a prospect drag out of you on a call is markup on your CAC. Pull the evidence forward: a security-questionnaire pack, a peer reference from the same regulated segment, and a hard ROI model handed over in the first two meetings instead of the fifth. Pair that with a predictable, instrumented sales motion so you can see which evidence actually moves the deal. You won't get FinTech CAC down to commerce levels — the regulator won't allow it — but shaving the trust tax is what separates a 23-month payback from a materially shorter one.
In 2025 the company that wins isn't the one growing fastest; it's the one that knows, line by line, what each customer costs and can prove the next one will cost less. For a deeper read on the threshold that scares investors most, the CAC payback diagnostic is where I'd start.