
The practical answer
- Short answer
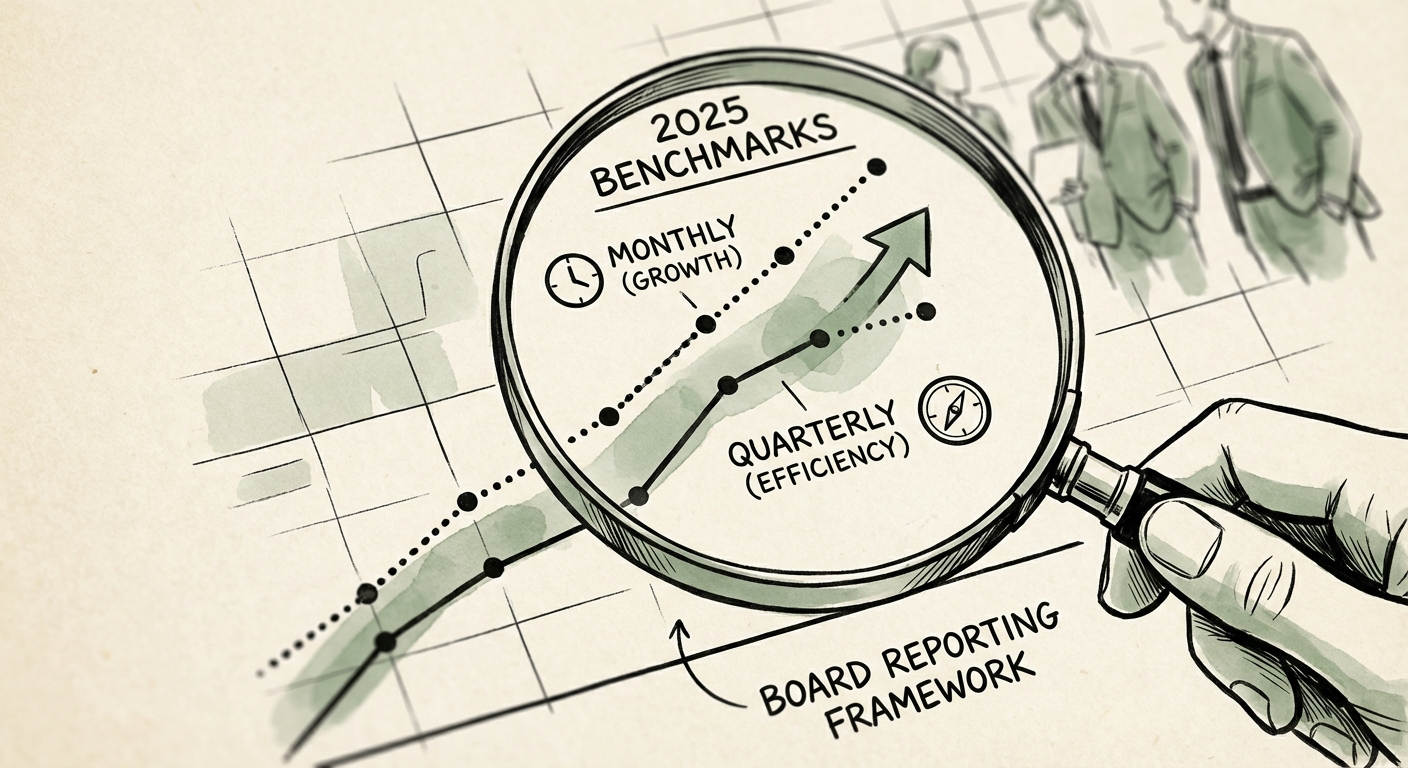
- A Series B founder's split between a one-page monthly flash and a strategic quarterly deck — with the 2025 benchmarks your board already knows by heart.
- Best fit
- Industry: B2B Tech. Function: Finance
- Operating path
- Financial Infrastructure → Commercial Performance → Valuations
- Key metric
- 20 Months Median CAC Payback (2025)
The 50-Slide Deck That Got a CEO Fired
Picture the third quarterly meeting after a $25M Series B. The CEO opens a deck and clicks past slide 12, slide 18, slide 31. Around slide 40 a lead director stops looking at the screen and starts looking at the CEO. By then the room already knows two things the slides were built to delay: the burn multiple drifted past 2.0x, and the number the founder promised last quarter came in light.
Nobody got fired for the miss. They got fired for the choreography around it — the sense that the deck existed to manage the board's perception rather than to inform a decision. Your investors each sit on five to ten boards. They do not have the bandwidth to forensic-audit your P&L, and when you make them try, they stop assuming sloppiness and start assuming concealment.
That is the real failure mode of Series B reporting, and it almost always comes from a single mistake: jamming operational pulse and strategic narrative into one document on one cadence. A cash-runway figure and a "should we move upmarket" debate do not belong on the same page or the same clock. Once you separate them, the monthly stops being a status anxiety ritual and the quarterly stops being a defense hearing.
A board can forgive a $1.9M quarter you called at $1.9M. They cannot forgive a $1.9M quarter you called at $2.4M — because now every number you give them gets a discount.
Two Documents, Two Jobs — Stop Merging Them
Here is the test for which document a metric belongs in: does it tell the board whether the plane is still in the air, or does it ask them to help fly it? The first goes monthly. The second goes quarterly. Anything that does both is two metrics wearing one label.
The monthly flash: one page, fifth business day, zero meeting
This is a check-engine light, not a dashboard tour. It should fit on a single screen and require no call to interpret. Four lines and one sentence:
- Cash and runway. The only number that can end the company. If it moves more than ~5% off plan, you do not wait for the email — you pick up the phone that day.
- MRR/ARR against the forecast you gave them. Not against last month. Against the number you committed to. Variance under 5% is the whole game.
- Weighted pipeline, this quarter and next. Coverage, not a CRM screenshot.
- Headcount vs. plan, with the one hire you landed or lost that actually matters.
- One red flag. A single sentence naming the biggest risk in the business right now. If you cannot name it, you are not reading your own company.
That is it. A board member should read the flash, nod, and close it. No nod means you buried something.
The quarterly deck: sent 72 hours early, read before the room
The deck is the homework; the meeting is the seminar. You are not there to recite history. You are there to decide things, and you open by orienting the numbers against benchmarks your investors already carry in their heads — because their first move is always to compare you to the rest of their book.
- Growth. Private SaaS growth has settled into the high teens to ~20% for 2025, per the year's benchmark reads (RockingWeb, 2025; Benchmarkit, 2025). Growing at 20% while burning like it is 50% is exactly the profile that ends fundability.
- CAC payback. The median has stretched toward roughly 20 months — which is also why a fractional-CFO playbook now treats payback discipline as a core diligence criterion (CFO Advisors, 2025). Frame your own number against where you are taking it, not just where it sits.
- Burn multiple. Sub-1.0x is the bar investors quietly respect; the typical company is closer to 1.8–2.0x. Show the trajectory, not a snapshot.
- NRR. Median lands near 101%, top quartile above 110% (Benchmarkit, 2025). If yours is under 100%, the deck should be about churn and expansion — almost nothing else earns the airtime.
- Rule of 40. Few companies clear it, and those that do trade at a meaningful valuation premium. So show the path to 40, not an apology for being below it.
Notice what is missing: line-item marketing variances, individual deal post-mortems, the org chart. Those are operating detail. Offer them unprompted and you invite the exact failure you are trying to avoid — three hours spent litigating a budget line while the company bleeds out somewhere else. If a board member wants the detail, they will ask.
Make It Run Without You — and Never Let the Board Be Last to Know
The framework only works if the underlying data is honest, and honesty is a function of automation. Say your VP of Finance spends three days hand-assembling the deck each quarter. Every one of those days is a window where optimism bias creeps in — a pulled-forward deal, a rounded-up renewal, a runway figure that assumes the hire slips. Pipe the numbers straight from your CRM and ERP into a standing dashboard so the monthly flash and the weekly flash report assemble themselves. Manual handling is where the surprises are born.
For Series B, hold yourself to roughly 95% forecast accuracy on both revenue and burn. That is the threshold where a board stops discounting your numbers. Miss by 10% or more for two quarters running and you no longer have a sales problem — you have a finance leadership problem, and the cure is an infrastructure of predictability, not a better-looking deck.
Then one rule overrides everything above: bad news moves in 24 hours, on its own clock. Lose an anchor customer or watch a flagship deal slip, and the board hears it the same day in three sentences — not in next month's flash, and certainly not on slide 40 of the quarterly. The ambush is the one unrecoverable sin of the founder-investor relationship.
Do this for two quarters and the relationship inverts. Your monthly flash earns a nod and a closed tab. Your quarterly deck opens a conversation about how to win rather than whether the numbers are real. Start Monday: cut your current board deck down to the one-page flash above, and write the single red-flag sentence first — before any chart, before any narrative. If you can't write it, that's your real agenda.