The practical answer
- Short answer
- Stop being blindsided by 'green' account churn. A diagnostic guide to building a predictive customer health score that actually correlates to revenue, not just sentiment.
- Best fit
- Industry: B2B SaaS. Function: Customer Success
- Operating path
- Revenue Architecture → Commercial Performance → Office of the CFO
- Key metric
- 46% Companies using health scores with NO forecast correlation
The 'Green' Account That Missed the Quarter
You’ve been there. It’s the second week of the quarter. Your VP of Customer Success presents a dashboard that is overwhelmingly green. According to the 'Health Score,' 92% of your ARR is safe. You roll this up into your board forecast, confidently projecting a 98% Gross Retention Rate.
Three weeks later, your second-largest account sends a cancellation notice. No warning. No support ticket spikes. No angry emails to the CEO. Just a cold email to your CSM stating they’re moving to a competitor.
When you demand answers, your CS leader points to the dashboard: “But they were logging in every day! Their health score was 85/100!”
This is the Watermelon Effect: Accounts that look green on the outside (dashboard) but are deep red on the inside (sentiment and value). It is the single biggest cause of missed revenue forecasts in Series B and C companies.
The Disconnect Between Activity and Value
The problem isn’t that you aren’t measuring. It’s that you’re measuring activity instead of outcomes. Most founder-led CS teams build health scores based on vanity metrics that are easy to track but have zero predictive power regarding commercial intent.
Industry data confirms this disconnect. A study by CSM Practice revealed that while 46% of companies use customer health scores to forecast renewals, there is statistically no correlation between the prevalence of these scores and actual forecast accuracy. If nearly half the market is using a metric that doesn't work, we have a structural failure in how we define 'health.'
For a Scaling CEO, this lack of visibility is existential. You cannot hire, invest, or fundraise on a revenue baseline that is 15% softer than your dashboard claims. You need a health score that speaks fluent EBITDA, not just fluent 'empathy.'
You cannot hire, invest, or fundraise on a revenue baseline that is 15% softer than your dashboard claims. You need a health score that speaks fluent EBITDA.
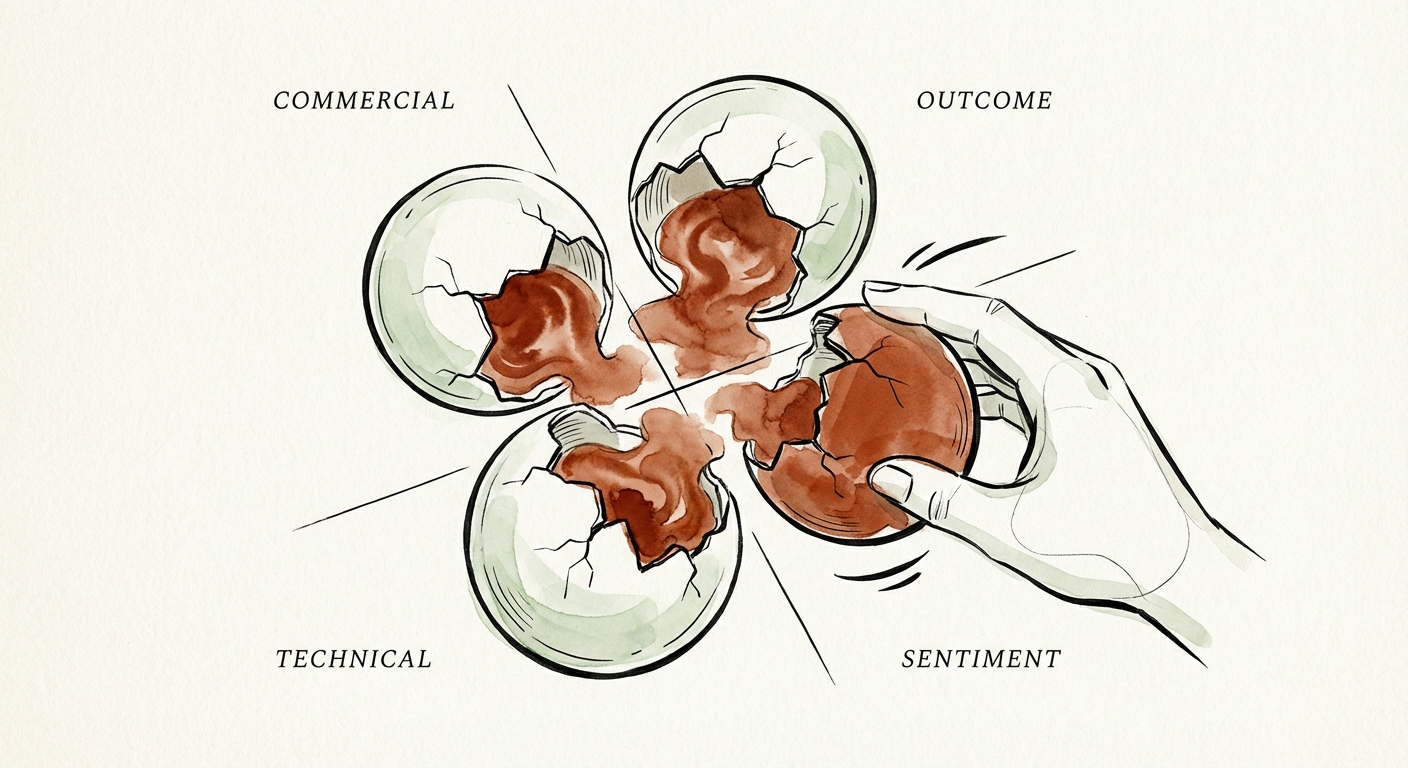
The 4-Part Revenue Signal Framework
To move from 'gut feel' to predictive accuracy, you must dismantle your current health score calculation. If your current formula is (Logins + Open Tickets + CSM Feeling) / 3, throw it out.
Effective revenue forecasting requires a weighted index of four distinct signals. We call this the Revenue Signal Framework.
1. Commercial Engagement (30% Weight)
Does the customer act like a partner who is staying? Activity does not equal commerce. You need to track commercial signaling.
- Executive Sponsor Activity: When was the last time a VP-level contact from their side attended a meeting? If it’s >90 days, the account is Red, regardless of daily user logins.
- Payment Hygiene: Are they paying Net-30 or drifting to Net-60? Accounts that pay late are often preserving cash for a transition.
- Contract Utilization: Are they using 90% of their licenses? Or 40%? Shelfware is the silent killer of renewals.
2. Outcome Velocity (30% Weight)
Are they getting what they paid for? This is different from usage. Usage is logging in; outcome is completing a workflow.
- Time-to-Value (TTV): For new cohorts, 70% of churn happens because value wasn't realized in the first 90 days. If they haven't reached 'First Value' by Day 30, they are pre-churned.
- Workflow Completion Rate: Don't measure clicks; measure completed cycles. If your software generates reports, are they downloading them?
3. Technical Health (20% Weight)
Is your product hurting them? This goes beyond support ticket volume. In fact, silence is often worse than noise. A noisy customer is engaged; a silent customer has given up.
- Bug Ratio: Percentage of tickets flagged as 'Bug' vs. 'How-to'. High bug ratios erode trust faster than any other metric.
- Integration Depth: Are they using your API? Accounts with deep technical integrations have higher switching costs and retain at 20-30% higher rates.
4. Sentiment & Relationship (20% Weight)
This is where 'CSM Gut Feel' lives, but it must be structured. Replace 'How do you feel?' with a binary risk assessment.
- NPS is a Lagging Indicator: Do not rely on it for forecasting.
- The Relationship Continuity Test: Would the champion take a call from us if they switched jobs?
Benchmarking Your Churn Risk
In 2025, the median B2B SaaS voluntary churn rate is approximately 2.6% (excluding involuntary payment failures). If your 'Green' accounts are churning at a rate higher than 5% annually, your definitions are too loose. You are giving yourself false comfort while revenue leaks out the back door.
Turning Scores into Actionable Revenue Forecasts
A health score is useless if it sits in a CS tool that Finance never sees. To fix your forecast, you must integrate these scores into your revenue cadence.
The 'Forecast Kill' Rule
Implement a hard rule for your sales and finance teams: No renewal can be committed to the forecast if the Health Score is below 70.
This forces alignment. If a Sales VP wants to commit a deal, but the Health Score is 65, they are forced to confront the CS team. Either the score is wrong (and needs recalibration), or the deal is risky (and should be moved to 'Best Case'). This ends the sandbagging and the blindsiding in one move.
The 'Save Squad' Protocol
When a key account drops into the 'Yellow' zone (e.g., score 60-75), it shouldn't just trigger an email notification. It should trigger a Save Squad—a rapid-response unit involving Engineering (to fix bugs), Executive Leadership (to realign sponsors), and Sales (to re-pitch value).
According to Bain & Company, a 5% increase in customer retention can increase profits by 25% to 95%. This isn't just about saving face; it's about EBITDA protection.
Conclusion: Systems Over Heroics
As a founder, you cannot personally save every account. You cannot hop on a plane every time a champion goes silent. You must build a system that detects smoke before the fire starts.
Stop accepting 'Green' accounts that churn. Audit your health score inputs this week. If you find 'Last Login Date' weighted higher than 'Executive Sponsor Engagement,' you know exactly why your forecast is missing. Fix the metric, and you fix the revenue.
Need to fix your retention metrics deeper? Read our guide on fixing NRR below 100% or explore how to transition from heroics to repeatable revenue.