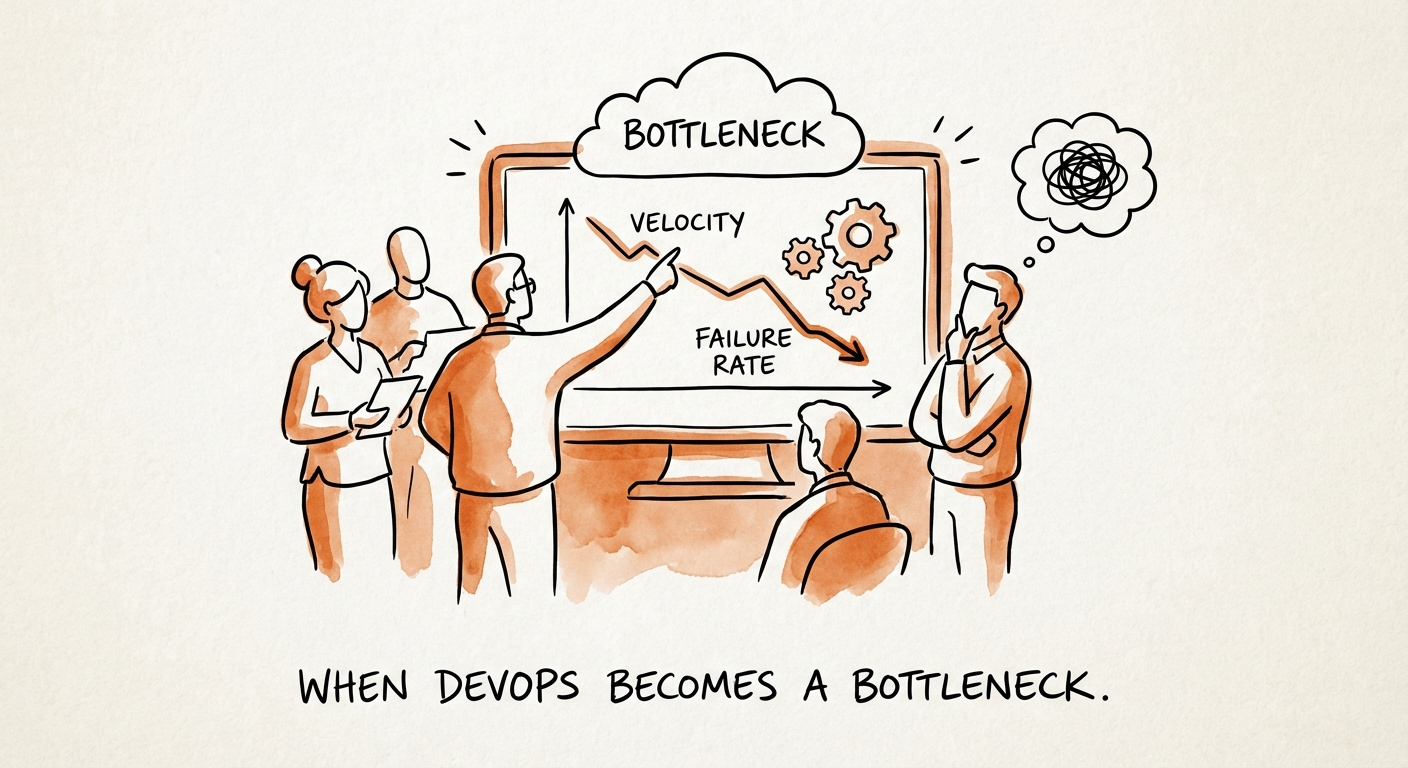
The board slide that doesn't add up
Picture a Series B B2B SaaS board deck. Slide 14 is headcount: engineering went from 15 people to 30 in eleven months, a clean line up and to the right, exactly what the round was for. Slide 15 is velocity. Features shipped per quarter is flat. The CTO has a slide to explain why, the founder-CEO has a knot in their stomach, and the lead investor is doing arithmetic: we paid to double the team and got nothing.
This is the moment that breaks a lot of B2B SaaS companies between $5M and $20M ARR, and it almost never gets diagnosed correctly in the room. Everyone reaches for the people explanation. The new hires aren't ramped. The senior engineers are stuck in onboarding. We need a better hiring filter. All plausible, all mostly wrong. You didn't hire slow engineers. You built a system where adding engineers makes the line longer instead of shorter.
Here's the mechanism. At $5M ARR your "DevOps" was one strong engineer who knew the AWS account better than anyone, held the deploy keys, and pushed the Friday-night build by hand. With a team of 15 sharing a Slack channel, that worked — coordination was free because everyone could hear everyone. Now you have 30 engineers and the same one person still owns provisioning, firewall rules, and every CI/CD fire. Your most expensive assets spend their mornings filing tickets to get a database stood up. I call the failure mode TicketOps: infrastructure run as a help desk instead of a product. The queue depth, not the team's talent, is now the governing variable for how fast you ship.
And the cost is not abstract. Stripe's research found developers spend roughly a third of their time fighting technical debt and maintenance instead of building. On a $5M engineering payroll that's $1.65M a year you are spending on friction — not on code, on waiting for code to be allowed to move.
Why hiring your way out (and AI) makes it worse
The intuitive fix is to throw bodies at it: hire two more "DevOps engineers" to work the ticket queue. Watch what actually happens. Two more people now have context on the infrastructure, which means two more people the 30 developers can route requests to — and two more people who can disagree about how a thing should be provisioned. You've added capacity to the service desk without removing the dependency on the service desk. The queue gets processed slightly faster and grows slightly faster, and net velocity barely moves. You can't staff your way out of a coordination problem.
The AI assumption fails the same way, just faster. A lot of founders are quietly betting that Copilot and Cursor will close the velocity gap — more code per engineer, problem solved. The DORA research points the other direction: as AI adoption rose, teams saw delivery throughput dip and stability degrade, not improve. The reason is pure queueing theory. Generating code faster doesn't ship anything faster if the constraint is the deployment pipeline. AI just produces more work-in-progress piling up in front of the same bottleneck. You revved the engine while the garage door stayed shut, and now there's a bigger pile of half-finished inventory rotting in branches — which is exactly how velocity quietly becomes a drag on the P&L.
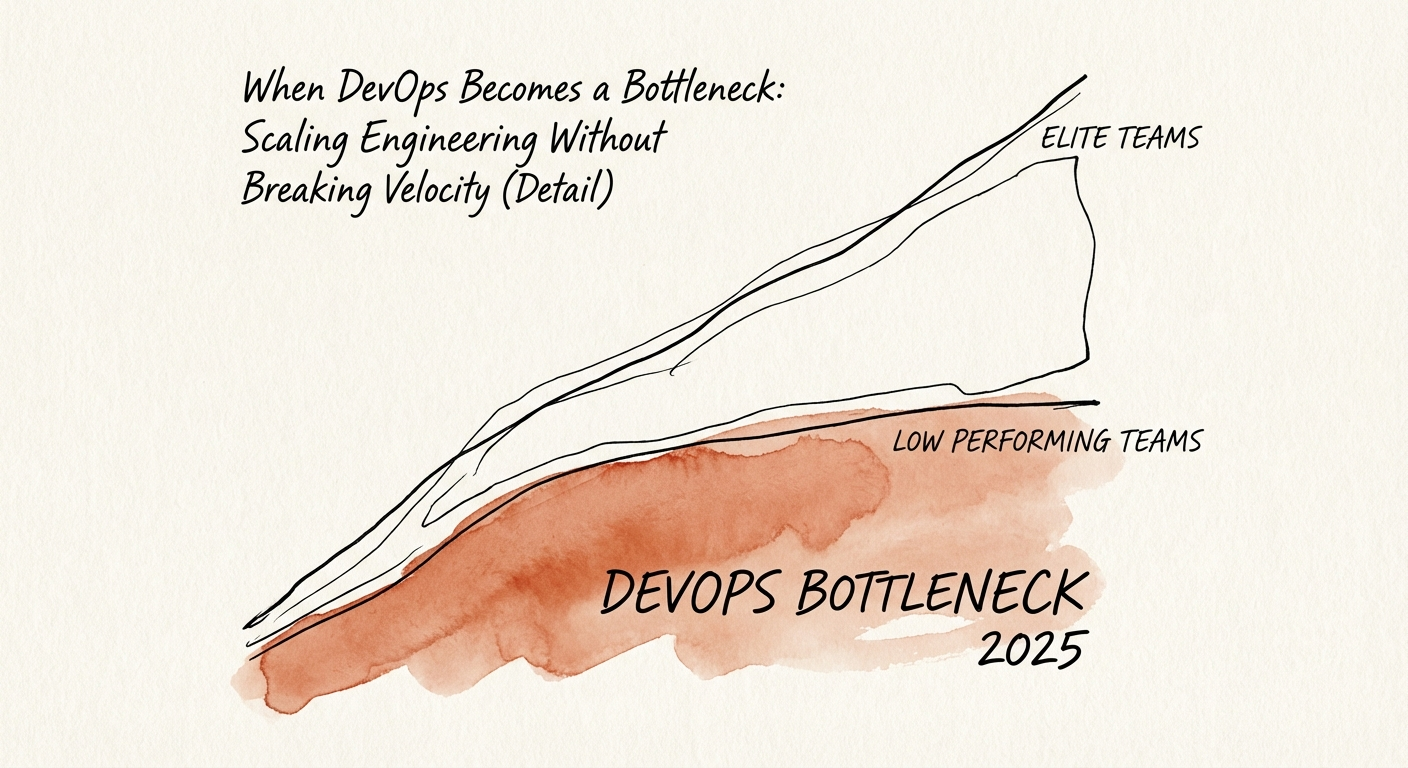
There's a structural reason this is urgent for a Series B SaaS company specifically. The same DORA work shows the comfortable middle is collapsing: the share of teams in the high-performing tier shrank while the low-performing tier grew. The "good enough, we'll fix it after the next raise" operating point is disappearing. You are either building toward a deployment system that lets 30 people ship independently, or you are sliding backward into a state where every release needs a designated "release captain" to babysit it to production. That captain is a tax on every single feature, and the gap between paying it and not isn't engineering vanity — it's growth. McKinsey's data ties top-tier developer velocity to 4-5x faster revenue growth, because shipping daily means you iterate on real customer signal while slower competitors are still in code review.
What a founder-CEO actually does Monday
The fix is to stop hiring people to close tickets and start funding a small platform team whose product is self-service. Three concrete moves, in order.
Build one Golden Path before you build two. Pick the single most common way code gets to production at your company and make it paved: a standard CI/CD template, a standard service scaffold, automated provisioning behind a command instead of a ticket. A developer who stays on the paved road gets to production with no human approval. A developer who insists on bespoke infrastructure owns its maintenance forever. That one rule reassigns the incentive — going off-road stops being free — and it's where the debt-paydown work actually compounds. Don't try to platform-engineer everything at once; pave the one road 80% of your traffic uses.
Put four numbers in the board deck, retire the rest. Replace "lines of code" and "hours worked" with the four DORA metrics: deployment frequency (how often do we ship), lead time for changes (commit to production), change failure rate (how often a deploy breaks something), and time to restore service (how fast we recover). The instructive contrast for your team: the low-performing pattern ships weekly or monthly and takes over a week to recover from a bad change, while the elite pattern ships on demand and recovers in under an hour. Track the four, and the queue problem stops hiding inside a green headcount chart.
Pay the 15-20% tax on purpose. Reserve a standing 15-20% of engineering capacity for platform work and debt paydown — not "when we have time," permanently, in the sprint plan. This is the line item founders cut first under feature pressure, and it's the one the system collects anyway. Skip it and you don't avoid the cost; you pay it later through outages and unplanned downtime at a far worse rate. The honest reframe for a CEO: your engineers aren't slow, you've put them in a maze. Your job isn't to ask them to run faster — it's to bulldoze the walls.