
The practical answer
- Short answer
- Your CTO says "refactor." Your IC hears "delay." Here's how to convert technical debt into a defensible EBITDA add-back PE sponsors can actually underwrite.
- Best fit
- Industry: Private Equity. Function: Engineering
- Operating path
- Technical Debt → Turnaround & Restructuring → Transaction Advisory Services
- Key metric
- 13.5 Hours/week average developers spend on technical debt (Stripe)
Two people in a board meeting, both convinced the other one is lying
I sat in a portfolio review last year where the Operating Partner pulled up the R&D line, tapped it twice with a pen, and asked the CTO a fair question: "We've spent $9M over eighteen months. Show me what shipped." The CTO started talking about a migration off a monolith, a queueing layer, and a billing service that "needed to be stabilized before we could move." The OP heard a man explaining why he missed his numbers. The CTO heard a man who didn't understand that the numbers were being eaten alive by the system he inherited.
Neither was lying. They were running on different ledgers. And the gap between those two ledgers is exactly where middle-market value goes to die — not in a dramatic blowup, but in a slow leak nobody books.
Here's the leak, in numbers a finance person can hold. Stripe's Developer Coefficient found the average developer burns 13.5 hours a week wrestling with bad code and technical debt. Run that against a $10M engineering payroll and you are spending roughly $3.3M a year servicing interest on decisions made before you owned the asset — and most of it is sitting inside the R&D line wearing a costume that says "innovation." It is not innovation. It is debt service, mislabeled.
The reason this never gets fixed is not that the OP doesn't care. It's that nobody at the table can convert "the billing module is a mess" into a dollar figure the investment committee will let you underwrite. Until you build that conversion, the CTO will keep asking for headcount and the OP will keep saying no, and both of them will be right.
In diligence I've watched a sponsor knock a full turn off the offer because the CTO couldn't say what the broken billing module cost in dollars. The code wasn't the problem. The silence was.
The bridge has three planks, and each one is denominated in cash
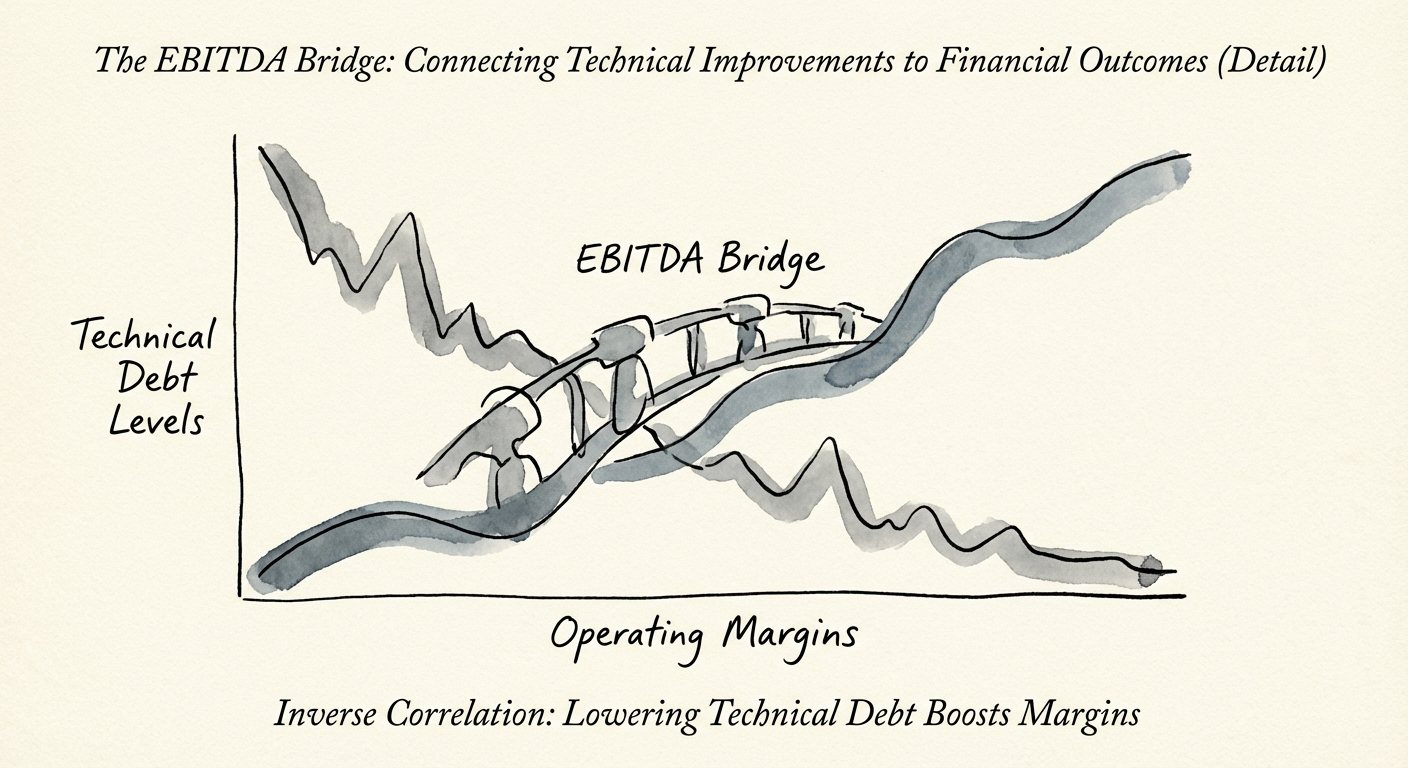
A real EBITDA bridge doesn't ask the OP to trust engineering judgment. It restates engineering activity in the three currencies a deal team already uses: where the money goes, what defects cost downstream, and whether speed is rising or rotting. Build these three and you stop arguing about "tech debt" and start arguing about return on a capital project, which is an argument everyone in the room knows how to have.
Plank 1 — Where is the payroll actually going?
In a platform you'd be proud to sell, 70–80% of engineering hours go to new value and the rest to keep-the-lights-on. In a debt-heavy asset that ratio inverts. I diligenced a SaaS business where 65% of cycles were unplanned work — hotfixes, firefights, the same billing bug reopened for the fourth time. The fix isn't "morale." If you can claw back 20% of engineering capacity by killing the unplanned work, you have effectively added 20% headcount with no incremental payroll. That capacity reallocation lands straight on the P&L as margin, not as a feeling.
Plank 2 — The defect that costs $100 today and a customer next quarter
Bad code doesn't stay in engineering; it leaks downstream and gets more expensive every step it travels. The Consortium for Information & Software Quality found in its Cost of Poor Software Quality report that defects are radically cheaper to kill early than in production. A bug shipped to a customer doesn't cost an engineer an hour — it opens a support ticket, escalates, pulls a CSM off renewals, drags a senior engineer off the roadmap, and occasionally costs you the logo at renewal. Tie defect density (bugs per release) to support labor and churn, and a $200K test-automation spend stops being a cost center. It becomes a line you can defend: spend here, save there, net add-back claimable inside the hold period.
Plank 3 — Velocity is a leading indicator of margin, not a vanity metric
This is the plank that connects the whole thing to the thesis. McKinsey's Developer Velocity research found that top-quartile-velocity firms run 20% higher operating margins than the bottom quartile. Speed isn't a developer perk; it's the observable surface of an efficient cost structure. So when your CTO asks for a refactor budget, the answer isn't yes or no. It's: "Show me which quartile this moves us toward and what that does to unit economics." That question is the real job of technical diligence — not counting open-source licenses, but pricing the velocity potential of the asset you're about to own or sell.
What I'd put in motion in the first 100 days
Demand a Technical Quality of Earnings, not a code review. A QoE for engineering treats the org as a financial object: where does the money go, what does failure cost, and how fast is the value compounding or decaying. Three concrete moves.
- Run a five-day quantitative scan, then cross it against timesheets. Measure cyclomatic complexity and code churn on the actual repo. Now lay the engineering hours on top. If the team is logging 50-hour weeks against a high-churn billing module and shipping one feature a month, you haven't found a lazy team — you've found the exact interest payment that's suppressing the line. That module is your highest-yield target.
- Ring-fence remediation as a capital project, not a "fix it when you can." Spare-time debt paydown never happens; the roadmap always wins. Give it a named budget, a 100-day clock, and a single highest-interest target. Underwrite the asset you actually own instead of pretending the debt isn't on the balance sheet.
- Track return on refactoring like any other deal. Cloud bill down 15%? Support tickets down 30%? Release cycle from four weeks to two? Book each one. By exit you want a paper trail proving the margin is durable.
The exit story this buys you
At the table, you are selling one of two things: a platform or a project. A project survives on heroics — a room of engineers holding the system together at 11pm so the demo doesn't break. A platform ships predictably, costs little to maintain, and carries margin a buyer will pay up for. Build the bridge during the hold, and you don't just clean up code. You make the 20% margin legible and defensible to the next buyer — which is the difference between a story they discount and a number they underwrite.