The practical answer
- Short answer
- Stop talking about 'refactoring.' Learn how to quantify technical debt in dollars using the Maintenance Tax and Opportunity Cost framework. Benchmarks included.
- Best fit
- Industry: B2B SaaS. Function: Engineering
- Operating path
- Technical Debt → Turnaround & Restructuring → Transaction Advisory Services
- Key metric
- 42% Of Developer Time Wasted on Maintenance (Stripe)
The Board Doesn't Care About Code Quality. They Care About Capital Allocation.
If you walk into a board meeting and ask for $2 million to "refactor the legacy codebase," you will lose. In the eyes of a financial sponsor or a non-technical board member, "refactoring" sounds like a hobbyist's pursuit of perfection—a cost center with zero ROI. They hear: "We want to stop building new features that generate revenue so we can polish the features we already sold."
This is why technical leaders struggle to get budget for debt paydown. You are translating an engineering problem into an engineering solution, rather than a business problem into a financial liability. To win the argument, you must stop speaking in terms of code complexity and start speaking in terms of Capital Efficiency.
Technical debt is not an abstraction. It is an off-balance-sheet liability that compounds like high-interest credit card debt. According to the Consortium for Information & Software Quality (CISQ), the cost of poor software quality in the U.S. alone has reached $2.41 trillion. For your company, this manifests as a silent tax on every dollar you spend on R&D.
When your engineers say "the code is messy," what they actually mean is: "For every $1.00 you pay me, you are only getting $0.58 of value. The other $0.42 is being burned on interest payments."
When your engineers say 'the code is messy,' they mean: 'For every $1.00 you pay me, you are getting $0.58 of value.' The rest is interest payments.
The 3-Part Formula for Dollarizing Technical Debt
To get the budget, you must present a "Technical Debt Balance Sheet." This framework converts vague frustrations into three hard dollar categories: Direct Waste (P&L Impact), Opportunity Cost (Growth Impact), and Risk Liability (Enterprise Value Impact).
1. The Maintenance Tax (Direct Waste)
This is the easiest metric to calculate and the hardest for a Board to ignore. It answers the question: What percentage of our payroll is spent fixing yesterday's work instead of building tomorrow's revenue?
The Benchmark: According to Stripe's Developer Coefficient report, the average developer spends 42% of their time dealing with technical debt and bad code. That is 13.5 hours per week, per developer, poured down the drain.
The Calculation:
- Total Engineering Payroll: $10M (example)
- Maintenance Allocation: 42% (Industry Average) or use your Jira data (Ticket Category: 'Bug/Refactor' vs 'Feature')
- Annual Waste: $4.2M
When you show a slide stating, "We are currently incinerating $4.2M of our $10M budget annually on maintenance due to legacy debt," the conversation shifts immediately from "why refactor?" to "how fast can we fix this?"
2. The Innovation Drag (Opportunity Cost)
Research from CodeScene's 2024 studies shows that development is 124% faster in healthy codebases compared to debt-ridden ones. High technical debt doesn't just cost money; it costs time.
If your roadmap includes an AI feature projected to generate $2M ARR in Year 1, and technical debt delays launch by 3 months, that is $500k in vanished revenue. Combine this with the 4-5x revenue growth correlation found in McKinsey's Developer Velocity Index, and the cost of inaction becomes indefensible.
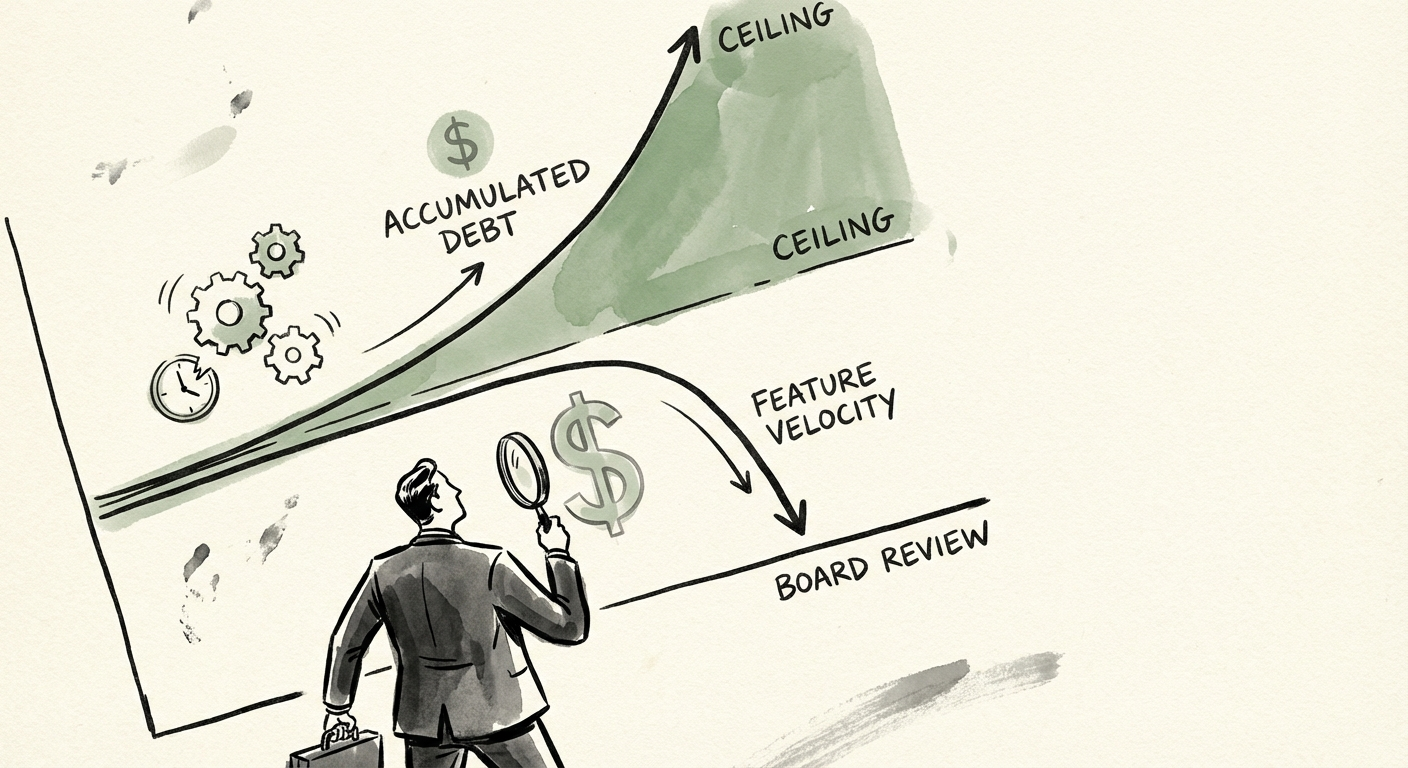
The "Debt Ceiling" Action Plan
Once you have quantified the problem, you need a governance policy, not just a one-time cleanup project. We recommend implementing a "Debt Ceiling" policy similar to financial covenants.
Step 1: Set the Cap
Establish a board-level metric: "Maintenance Spend shall not exceed 20% of Engineering Capacity." If the metric spikes to 25% (as measured by Jira allocation or automated code analysis), an automatic "Stop the Line" policy triggers. New feature development pauses, and resources divert to debt paydown until the ratio returns to the safe zone.
Step 2: The Remediation ROI Slide
Present your request for remediation budget as an investment product:
- Investment: $500k (3 Senior Engineers for 6 months)
- Action: Decouple the monolithic billing service.
- Return: Reduces Maintenance Tax from 42% to 25%.
- Annual Savings: $1.7M in regained productivity (Recurring).
- Payback Period: 3.5 months.
Conclusion: It's Not About Code, It's About Speed
Your Board doesn't need to know how microservices work. They need to know that your current infrastructure is a high-interest loan that is consuming your runway. By quantifying technical debt in dollars, you transform a complaint into a business case. You move from being a cost center asking for permission to an operator protecting the asset's value. For a deeper dive on how this impacts exit value, read The EBITDA Bridge: How to Convert Technical Debt into Margin Expansion.