The practical answer
- Short answer
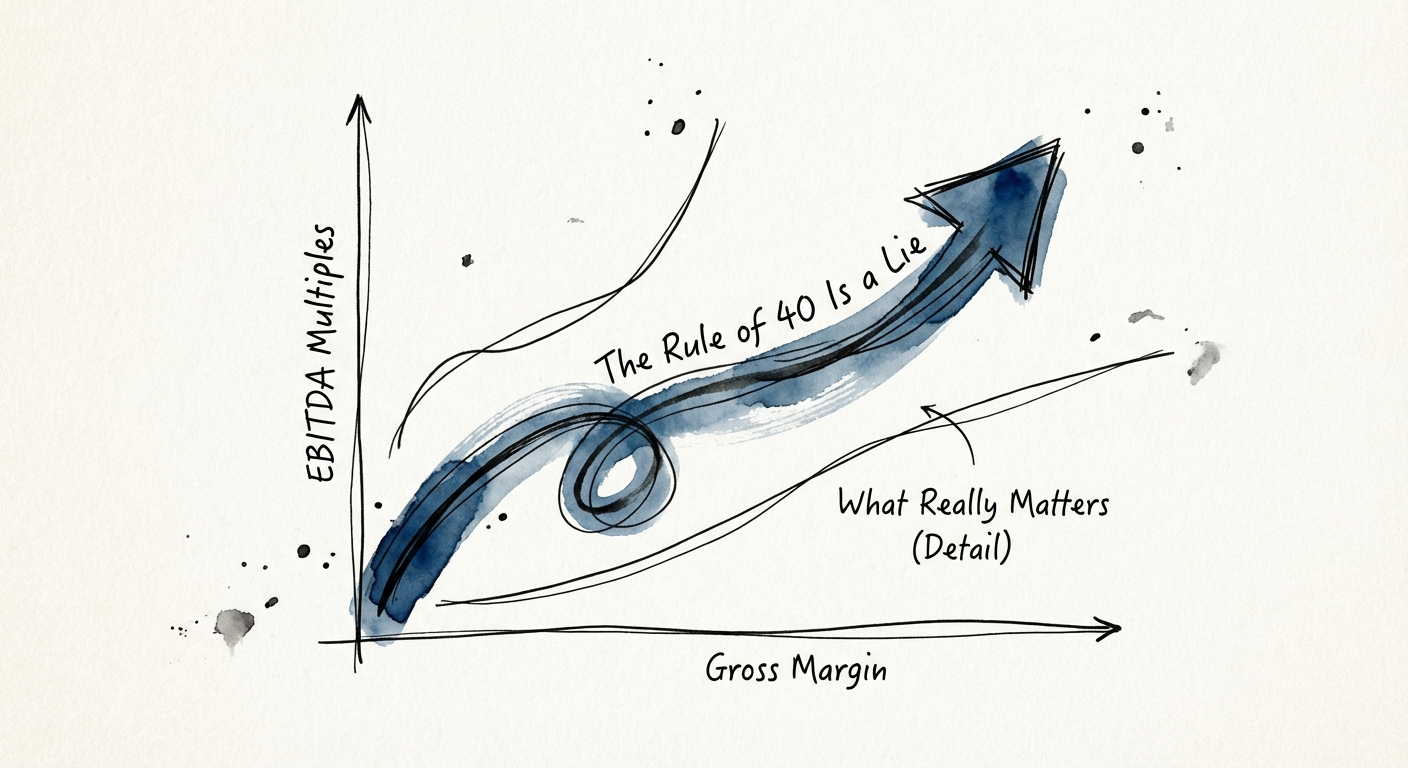
- Why the Rule of 40 misprices tech-enabled services firms — and the gross-margin math that actually separates a 5x exit from an 11x one in 2025 diligence.
- Best fit
- Industry: Tech-Enabled Services. Function: Finance
- Operating path
- Unit Economics → Commercial Performance → Transaction Advisory Services
- Key metric
- 50%+ Target Gross Margin for Premium Valuation
The number that survived diligence — and the one that didn't
Picture the diligence room. A 110-person tech-enabled services firm walks in with a clean Rule of 40 story: 28% growth, 13% EBITDA margin, a score of 41. The deck says "platform." The seller is anchoring on 11x. Three weeks later the quality-of-earnings work comes back, and the buyer's revised letter says 5.5x. Same company. Same growth. What moved was the one line the Rule of 40 doesn't see: gross margin sat at 31%, and the growth had been bought by hiring delivery staff faster than the firm could bill them.
This is the trap. Rule of 40 = Growth Rate + Profit Margin ≥ 40%. It is a genuinely useful instrument — for software, where the next dollar of revenue arrives at ~85% gross margin and growth compounds operating leverage. Drop that same ruler onto a managed-services firm, a digital agency, or a consultancy, and it lies to you, because in a people-based business growth and margin are not additive. They fight.
In SaaS, growth fixes the P&L. In services, fast growth often strains it: every new logo means new delivery headcount, new ramp time, new utilization risk, and a chart of accounts that drifts further from reality. A firm chasing a 30% growth number to satisfy a score is not building leverage — it's manufacturing a fragile staffing model where this quarter's hires exist to put out last quarter's delivery fires. That's why software trades on revenue multiples and services trade on EBITDA multiples. The market already priced the difference. The Rule of 40 just hides it from the person who needs it most: the operating partner approving the next hiring plan.
A services firm growing 30% on 25% gross margin isn't a Rule of 40 winner — it's a staffing agency scaling its own delivery risk one hire at a time. The exit multiple knows the difference even when the board deck doesn't.
Gross margin is the multiple, dressed up as an operating metric
Here's the spread that actually matters in 2025 services transactions. Generalist consultancies and body-shop staffing firms clear at roughly 4x–6x EBITDA. Specialized, genuinely tech-enabled firms command 9x–12x. The variable that explains almost all of that gap is not growth rate — it's gross margin. First Page Sage's 2025 EBITDA multiple data puts managed services at a median around 10.8x while general software development sits lower; the premium is paid for margin depth and predictability, not top-line speed.
So replace the Rule of 40 with a target a buyer will actually underwrite. For a tech-enabled services firm, premium unit economics look like this:
- Gross Margin: 50%+ — service revenue minus direct delivery labor. In SaaS, 50% is a distress signal. In services, it's the line between "platform" and "agency with a nicer website." 2025 gross margin benchmarks by industry show how far most firms sit below it.
- Billable Utilization: ~75% — high enough to be profitable, low enough that you aren't burning the bench you'll need next quarter.
- EBITDA Margin: 20%+ — the floor where the EBITDA multiple itself starts climbing.
Walk the math out and the Rule of 40 inverts. Say Firm A grows 10% with a 25% EBITDA margin (Rule of 40 score: 35) on 52% gross margin. Firm B grows 40% with a 5% EBITDA margin (score: 45) on 30% gross margin. The Rule of 40 prefers B. Every PE buyer in the room prefers A — because A is a cash engine with pricing power, and B is a leveraged bet that the labor market and client retention both cooperate forever.
When the chart of accounts is too messy to trust margin on day one — and it usually is — reach for the metric that's hardest to fake: revenue per employee. SaaS Capital's 2025 RPE benchmarks and adjacent services data point efficient tech-enabled firms toward $200K–$250K+ per head. A firm stuck near $140K is selling hours, not outcomes — and the multiple will say so before the seller does.
The 90-day move: convert growth back into margin before the next QoE
You've inherited the firm growing 25% and bleeding cash, and the founder keeps quoting the Rule of 40 to defend the spend. You don't argue the framework — you change what gets measured. Three moves, in order, because the sequence matters.
1. Find the hollow revenue first. Run client-level profitability before you touch utilization. The "whale" accounts driving that 25% are frequently the worst margin accounts — bid low to win, then over-serviced into 30% gross margin through scope creep nobody re-priced. Renegotiate them or let the bottom decile go. Deliberately shrinking revenue to lift margin is a legitimate value-creation lever; a buyer pays for the margin, not the line you deleted.
2. Fix the utilization leak — at the work, not the people. Don't just push the team harder. The leak almost always lives in non-billable delivery: engineers doing pre-sales, unbilled travel, senior people rewriting junior work. Move that work to a cheaper resource layer or automate it, and track billable utilization toward 75% as a managed number, not a guilt trip.
3. Sell IP, not IQ. The bridge from 6x to 10x is "tech-enabled," and that does not mean building a product. It means productizing delivery: turn a one-off "custom migration" into a fixed-scope, scripted "Migration Accelerator" you price on value (the outcome) and deliver in half the hours. That single move decouples revenue from headcount — the exact thing the Rule of 40 can't see and the exact thing the multiple rewards.
In a 2025 market with expensive capital and patient buyers, nobody is paying for growth at all costs. They're paying for cash-flow quality. Stop measuring a services firm against a software ruler. Aim for 50%+ gross margin and 20%+ EBITDA, and let the diligence room do the rest — because at that level, the growth and the double-digit multiple stop being a hope in a deck and start being a number a buyer will sign.