The practical answer
- Short answer
- Your technical diligence report priced the debt at $500K. Six months post-close the roadmap is frozen. Here's why SaaS code scans miss the real liability.
- Best fit
- Industry: Private Equity. Function: Engineering
- Operating path
- Technical Debt → Turnaround & Restructuring → Transaction Advisory Services
- Key metric
- 33% of developer time spent on technical debt (Stripe)
The $500K line that becomes a frozen roadmap
Here is the sequence that should worry you, because it is almost always benign on paper. You are closing on a B2B SaaS platform. Commercial diligence is clean, the Quality of Earnings report ties out, and your technical diligence vendor runs an automated scan — usually some flavor of SonarQube — flags a handful of "critical" findings, and lands on a remediation estimate of around $500,000 post-close. You drop it into the 100-day plan as a one-time line and sign.
Six months later the picture is unrecognizable. The roadmap is frozen. The VP of Engineering wants three more headcount "just to keep the lights on." A feature integration scoped at two weeks is now in its second month. You are not paying down a $500K item — you are paying a recurring surcharge on every engineering hour the company logs, and it is showing up in the wrong place: not as CapEx, but as a quiet ceiling on EBITDA growth.
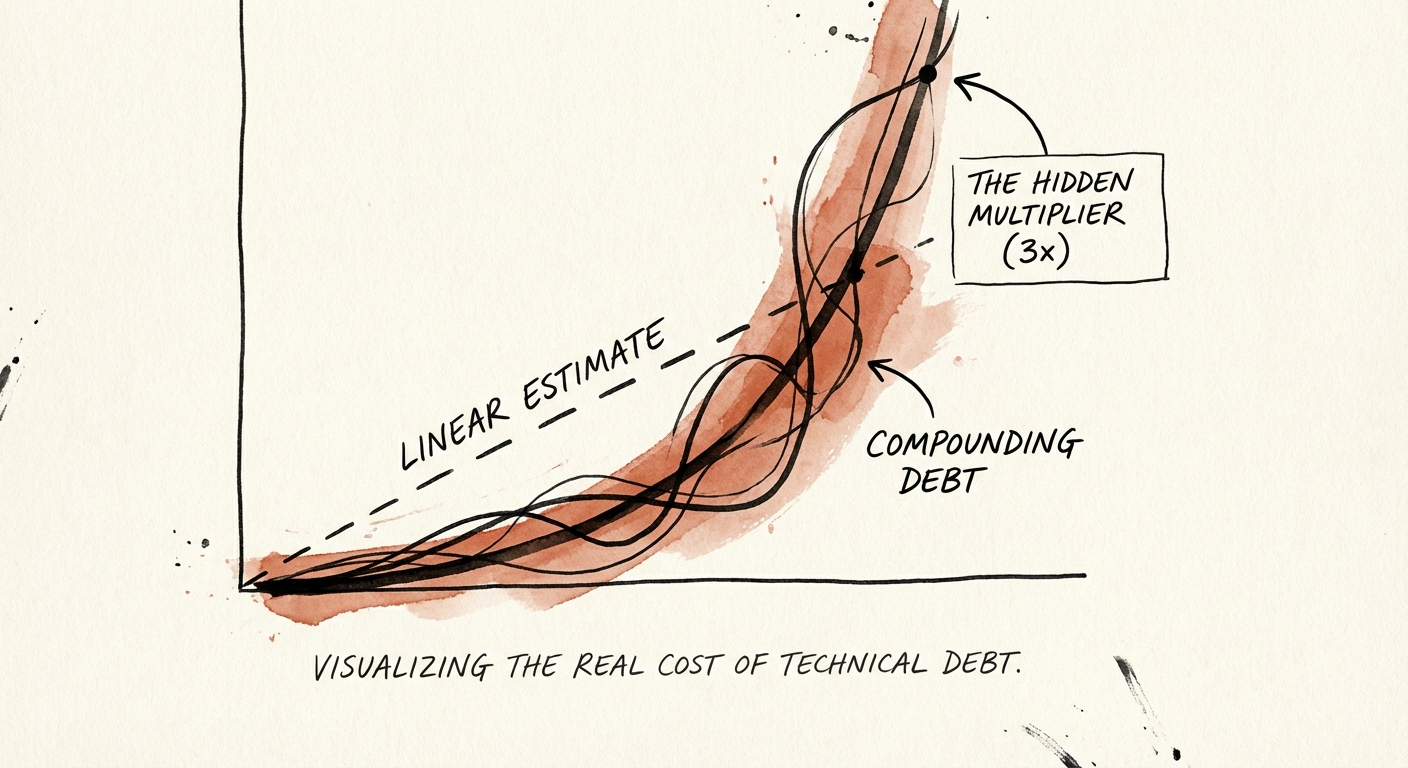
The failure is not the engineering team's and it is not the vendor's lack of effort. It is the document itself. A static code scan measures the cleanliness of code that already exists. It does not measure how hard it is to change that code — and in a SaaS business you are buying for its growth, change-cost is the entire thesis. The scan tells you the building has cracks. It cannot tell you which cracks are load-bearing. That gap is where your EBITDA case goes to die, and it is why the headline number in your diligence packet is routinely 3x light.
A code scan tells you the building has cracks. It does not tell you the cracks are load-bearing — that you cannot fix the second floor without first jacking up the foundation. That difference is the whole deal.
Three costs the scan never priced
The estimate in your report covers one thing: the labor to rewrite or patch flagged code. The actual liability has three layers stacked on top of it, and none of them appear in a SonarQube summary.
The carrying cost while you fix it
Remediation is not a clean swap-out. The team keeps shipping, supporting customers, and onboarding new logos while they untangle the old architecture, which means you pay for the debt and the cure simultaneously. McKinsey puts the standing technical-debt load at 20–40% of the entire value of the technology estate, with 10–20% of the budget meant for new products quietly redirected to debt. On a $10M engineering spend, that is $2M–$4M a year disappearing — a permanent haircut on effective R&D, not a one-time repair you can amortize away.
The engineers you bought but cannot deploy
The deal model almost certainly counts the engineering org as productive capacity. Stripe's research found developers spend roughly 33% of their week — about 13.5 hours — fighting technical debt and bad code. Buy 50 engineers and you have functionally acquired 33. The other 17 draw full salary to wrestle legacy complexity. This wrecks the synergy case in particular: you penciled in headcount reductions you physically cannot take, because a third of capacity is already committed to keeping the platform upright. It is the same dynamic that lets inefficient DevOps practices stay invisible until the first post-close roadmap slips.
The quarters of growth you forfeit
The most expensive layer never shows up as a salary line at all. When the architecture cannot absorb a new integration — say the AI feature your investment memo leaned on — the cost is not the engineers' time, it is the two quarters of revenue and the first-mover position you hand to a faster competitor. Gartner projects technical debt will consume more than 40% of current IT budgets, which is another way of saying it caps innovation outright for companies that do not remediate before it compounds. You did not buy a platform. You bought its rate of change — and that is precisely the thing the scan declined to measure.
What to demand before you wire the funds
"The code is messy" is not a diligence finding; it is an opinion. Replace it with three asks that produce numbers your deal model can actually consume. If you want to stop buying broken code at a clean price, this is the upgrade to your packet.
Ask for the dependency graph, not the scan summary. Have the vendor map cyclomatic complexity and dependency coupling across the core modules — the things change-cost actually lives in. The test is simple: if you cannot modify Module A without breaking B, C, and D, you are not refactoring in isolation, you are rebuilding. Tight coupling is the single best predictor that your remediation estimate needs to triple, because every "quick fix" drags three other systems with it.
Pull twelve months of tickets and run the maintenance ratio. Categorize the last year of engineering work into new-feature versus bug-fix-and-maintenance. If maintenance runs above 30%, you are looking at a distressed asset regardless of what the top-line growth chart says — the growth is being purchased with a maintenance backlog that will come due on your watch. Use that ratio to move the working-capital peg or to write a specific remediation indemnity into the docs.
Put the fix in the EBITDA bridge as investment, not as an add-back. If decoupling the monolith costs $2M, that $2M is not a problem to explain away — it is the entry fee to exit at a multiple a buyer will actually pay for a platform that can grow. Frame it as margin-expansion CapEx and underwrite to it. The objective was never zero debt; it is debt you can manage on a known schedule. So adjust the headline number, triple the timeline, and re-run the returns. If the deal still clears at the honest number, sign it with confidence. If it only worked at the scan's number, the scan just saved you.