The practical answer
- Short answer
- A diligence field manual: the 8 static-analysis numbers I read off a target's codebase in five days, the thresholds that flag a rewrite, and how each one moves the price.
- Best fit
- Industry: B2B Tech / SaaS. Function: Engineering
- Operating path
- Technical Debt → Turnaround & Restructuring → Transaction Advisory Services
- Key metric
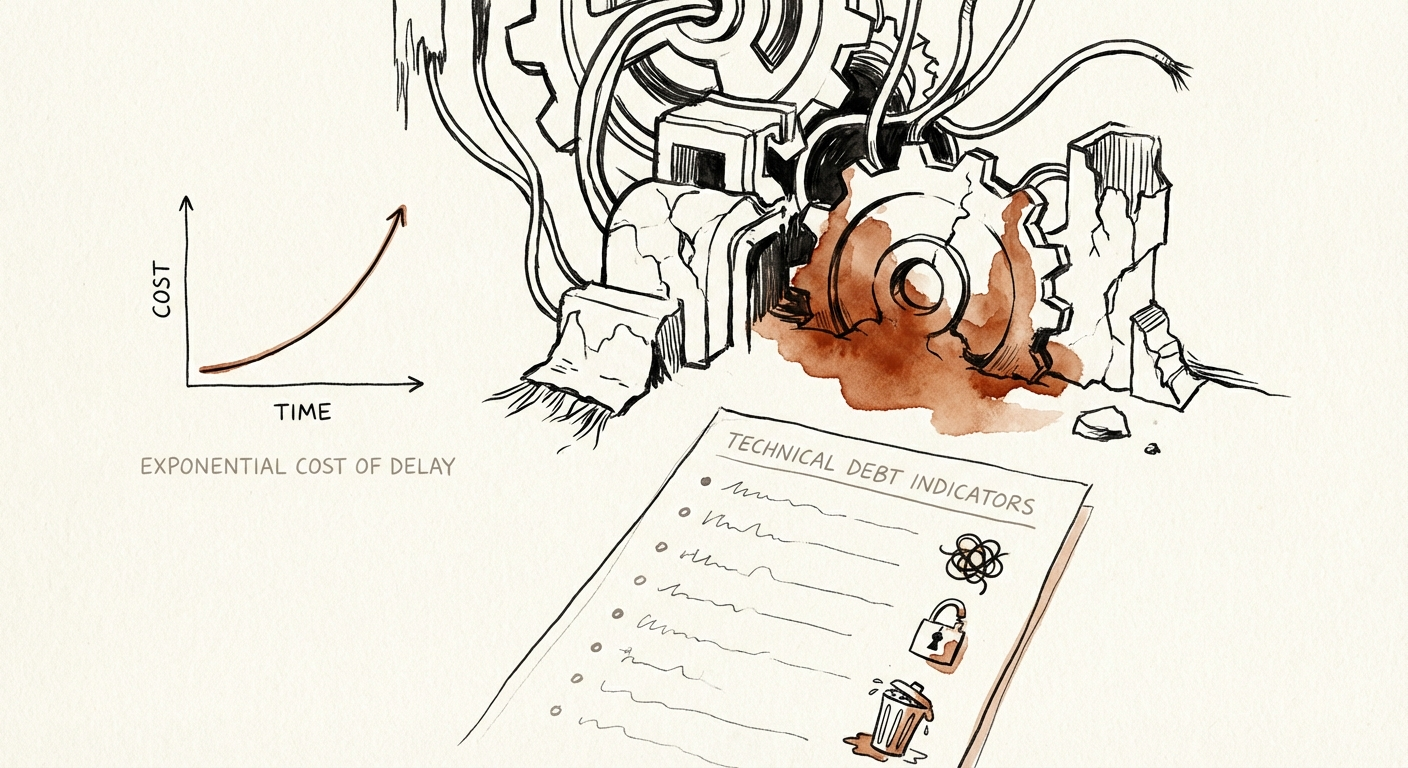
- 30x Cost multiplier to fix a bug in production vs. design phase
The number that isn't in the data room
By day three of diligence you usually know the revenue story cold. Net retention, gross margin, the QofE adjustments the seller's banker is fighting you on — all of it sits in the data room, tabbed and footnoted. What does not sit in the data room is the one number that decides whether the asset gets cheaper to run or more expensive every quarter you hold it: how much it costs to change the software.
That cost is technical debt, and it behaves like a loan nobody booked. The interest comes due as slower releases, ballooning hotfix work, and engineers who quietly refuse to touch the module that runs billing. The Black Duck 2025 review of audited deals found 96% of M&A transactions contained unpatched security vulnerabilities and 85% had open-source license conflicts (Black Duck, 2025). Those are not edge cases. That is the base rate.
Here is the useful part: you do not need to read the code to find the loan. You need eight readings off a static-analysis scan, and you can pull all eight inside a normal five-day window. Below is the checklist I run, the threshold that turns each one from amber to red, and what the number does to the price. Treat it as a worksheet — fill it in against your live target, not as theory.
A QofE report tells you what the company earned. A static-analysis scan tells you what it will cost to keep earning it. Only one of those is in the data room, and it's never the second one.
The eight readings, with thresholds
Run them in this order. The first four tell you whether the asset is operable; the last four tell you how fast it's getting worse.
1. Cyclomatic complexity on the top-10 hottest files (red line: median > 15)
Don't average the whole repo — that hides the rot. Sort files by change frequency, take the ten most-edited, and read complexity on those. They're the ones your team will be in every week. A median under 10 is fine; over 15 means each of those files has dozens of branching paths and resists testing. If your highest-churn files are also your most complex, you've found where every future bug will be born.
2. Bus factor on the core service (red line: 1)
Pull twelve months of commit history and check authorship on the revenue-critical service. If one person — usually the founding engineer who "keeps the architecture in their head" — owns the majority of those commits, the operating asset and the retention risk are the same person. When they walk after the earnout, capability walks with them. This is the single finding I most often turn into an escrow term.
3. Production-to-pre-production defect ratio (the 30x reading)
Compare bugs caught before deploy against bugs caught by customers. A team catching most issues pre-release is cheap to run. A team patching live every week is bleeding margin, because a defect found in production costs on the order of 30x what it costs to fix at design time (NIST, 2002). A high live-patch rate isn't an annoyance — it's a leading indicator of the margin you're modeling not showing up.
4. Test coverage on changed lines (red line: < 40%)
Ignore the headline coverage percentage; sellers game it with trivial tests. Look at coverage on lines that actually changed in the last quarter. Low coverage on hot code is what produces fear-driven development, where engineers stop touching legacy modules entirely and your roadmap freezes around the parts that make money.
5. Code duplication (red line: > 15%)
Duplication above 10–15% means a fix applied in one place silently leaves the same bug in three others. It also tells you the team copies rather than abstracts — a culture signal, not just a metric.
6. Dependency age and license posture
Inventory the third-party libraries. A core framework three years stale isn't just obsolete; it's the unpatched-vulnerability statistic above, sitting in your target. Pair this with the license scan — the 85% license-conflict rate from the Black Duck data is what turns into an unbudgeted remediation sprint after close.
7. Churn-against-comments on the same hot files
Take the high-churn files from reading #1 and check whether they're being rewritten repeatedly with little documentation. Repeated rewrites of the same code with no comments is the signature of a team that doesn't yet understand the problem — they're iterating by trial.
8. The linter-violation trend line (not the count)
One scan is a snapshot; the slope is the diagnosis. Pull violation counts month over month for the last year. Flat or declining means the team is paying debt down. Climbing means they're borrowing faster than they earn — and that trend, not today's number, is what compounds across a five-year hold. Forrester's read on the scale of accumulated debt in US software estates is why this slope matters more than any single reading (Forrester, 2024).
Turn the readings into price, not a panic
Eight red flags do not kill a deal. Every software company carries debt; you're not buying a pristine asset, you're buying a known one. The deal only breaks when the price ignores what the scan just told you.
So translate. Each red reading gets a number and an owner. Say the dependency scan implies a forced framework migration and the bus-factor-of-1 implies a six-month knowledge-transfer drag — put a dollar figure on both and structure a remediation holdback: a slice of the purchase price in escrow, released only when specific, scan-verifiable milestones clear (license conflicts resolved, coverage on hot files above 40%, the framework upgraded). You're not negotiating vibes; you're negotiating the same numbers from the checklist, now with a payment schedule attached.
Then protect the first quarter. Resist the urge to ship features on day one. Spend the opening 100 days re-running readings #1, #4, and #8 as a baseline and clearing the worst of the debt, because every point of velocity you buy back early compounds for the rest of the hold. The financial auditor will never see any of this. The operator who opened the codebase will price the asset on what's actually there — and that's the side of the table you want to be on.