The practical answer
- Short answer
- Benchmarks for technical debt allocation by Series A, B, and C. Research from McKinsey and Stripe reveals 33% of dev time is lost to debt. Here is the acceptable threshold.
- Best fit
- Industry: B2B SaaS. Function: Engineering
- Operating path
- Technical Debt → Turnaround & Restructuring → Transaction Advisory Services
- Key metric
- 33% Of average developer time is spent addressing technical debt and bad code.
The Invisible Tax on Your Valuation
You raised your Series B on the promise of ‘pouring fuel on the fire.’ You doubled the engineering team, bought the best tools, and mandated aggressive roadmap targets. Yet, six months later, your shipping velocity hasn't doubled. In fact, it has slowed down.
Your VP of Engineering blames ‘complexity.’ Your CFO blames ‘bloat.’ But the real culprit is likely the invisible liability sitting off your balance sheet: Technical Debt.
For founders and operators, technical debt is often treated as an abstract engineering complaint—something developers grumble about when they want to rewrite code. This is a dangerous misconception. Technical debt is a financial instrument. It is a high-interest loan you took out during the scrappy Seed and Series A days to buy speed. Now, at the scaling stage, the interest payments are coming due, consuming your team’s capacity.
According to Stripe’s Developer Coefficient report, the average developer spends 33% of their time dealing with technical debt and bad code. That is one-third of your payroll—literally one out of every three dollars you spend on engineering—being set on fire just to maintain the status quo.
If you don't quantify this debt, you can't manage it. And if you don't manage it, it will cap your growth regardless of how much capital you deploy. To scale successfully, you must transition from ‘ignoring debt’ to ‘servicing debt’ with the discipline of a CFO managing a credit line.
Technical debt is not an engineering complaint; it is a financial liability. It is a high-interest loan you took out to buy speed, and at Series B, the bill comes due.
The ‘Debt Ceiling’ Benchmarks by Stage
Not all technical debt is bad. In the early days, zero debt means you moved too slow. But as you scale, the acceptable ratio of ‘Debt Paydown’ to ‘New Feature Work’ shifts dramatically. Based on data from McKinsey, Gartner, and our own operational turnarounds, here are the healthy benchmarks for technical debt allocation by company stage.
1. Seed & Series A: The ‘Move Fast’ Phase
- Target Debt Allocation: 10-15% of Sprint Capacity
- Acceptable TDR (Technical Debt Ratio): < 10%
At this stage, speed is the only metric that matters. You are buying product-market fit with code quality. It is acceptable to hard-code features, skip documentation, and build monolithic services. The ‘interest rate’ on this debt is low because if you don’t find product-market fit, the code won’t matter anyway.
2. Series B: The Danger Zone
- Target Debt Allocation: 20-25% of Sprint Capacity
- Acceptable TDR: 15-20%
This is where most companies stall. You have traction, but your ‘MVP’ codebase is now supporting enterprise customers who demand 99.9% uptime. The friction begins to compound. If your team is spending more than 30% of their time on fixes, you are in the ‘Debt Spiral.’ McKinsey research indicates that companies in the bottom 20% of debt management are 40% more likely to have failed modernization efforts.
At Series B, you must institute a ‘Tax’ on every sprint: 20% of engineering hours must be dedicated to refactoring and paying down the highest-interest debt. This is not optional; it is the cost of maintaining velocity.
3. Series C & Exit Readiness: The ‘Stability’ Phase
- Target Debt Allocation: 15-20% Continuous
- Acceptable TDR: < 10%
As you prepare for PE acquisition or IPO, stability and predictability trade at a premium over raw feature speed. Acquirers will conduct a code audit. If they find high technical debt during due diligence, they will model a ‘remediation cost’ and deduct it directly from your enterprise value. We often see tech debt priced in as a 10-20% valuation haircut if critical systems are deemed ‘end-of-life’ or unscalable.
The 70/20/10 Rule for Debt Management
You cannot simply tell your team to ‘fix the debt.’ That usually leads to the ‘Big Rewrite’ trap—a six-month black hole where no new features are shipped, and the business stalls. Instead, you need to ‘refinance’ the debt continuously.
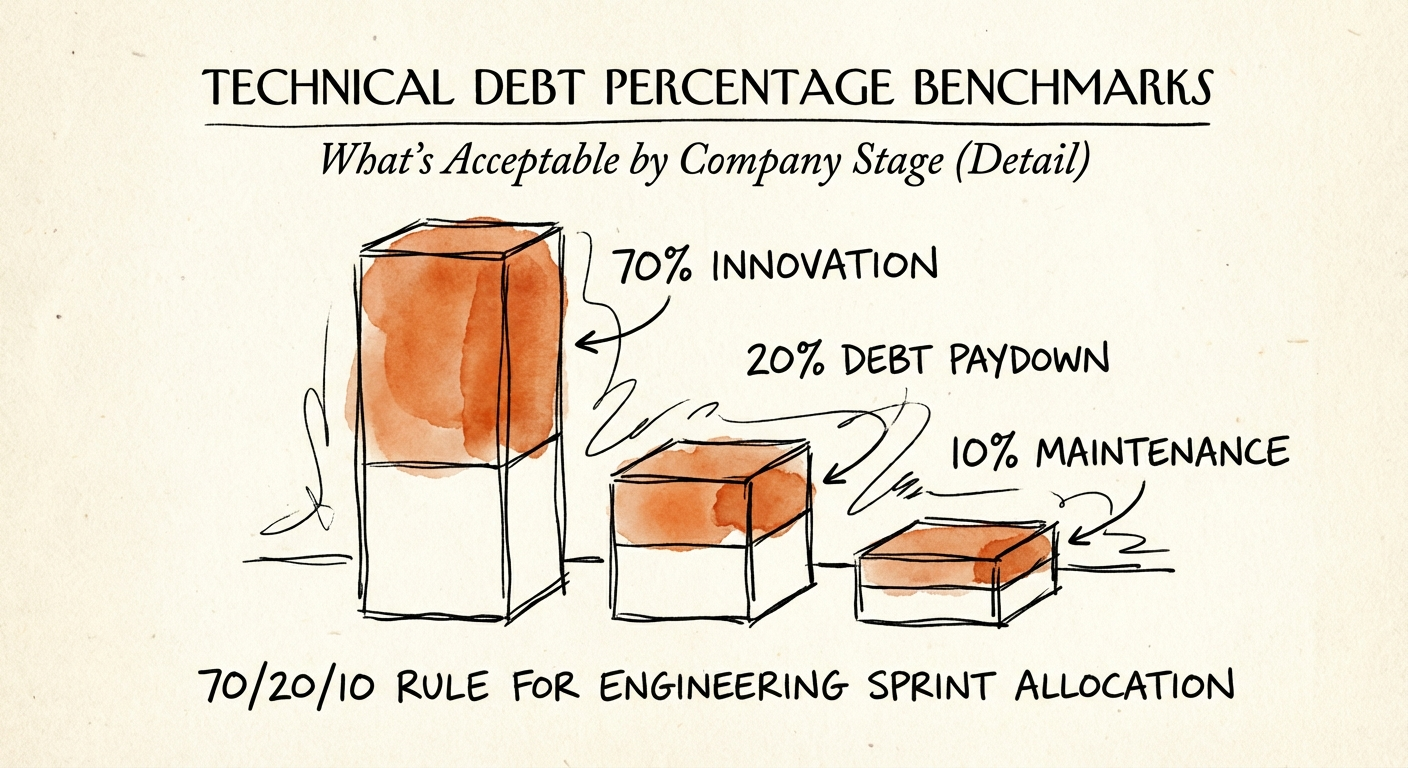
Adopt the 70/20/10 Allocation Rule for every engineering sprint:
- 70% Innovation: New features, revenue-driving capabilities, and market expansion.
- 20% Debt Paydown: Refactoring legacy code, improving test coverage, and automating manual processes. This is your interest payment.
- 10% Keep-the-Lights-On (KTLO): Routine maintenance, minor bug fixes, and patches.
How to Implement This Tomorrow
First, stop treating tech debt as a subjective feeling. Quantify it. Track the ‘Friction Ratio’: asking developers to tag tickets as ‘New Value’ vs. ‘Fix/Refactor.’ If the Fix/Refactor bucket exceeds 25% for two consecutive quarters, you have a structural problem.
Second, align your product roadmap with your engineering reality. Give your CTO air cover to push back on feature requests that would push the debt ratio into the red zone. Gartner predicts that organizations actively managing tech debt will achieve at least 50% faster service delivery than those that do not.
Technical debt is inevitable. Drowning in it is optional. By standardizing a 20% paydown allocation, you convert a looming crisis into a manageable operating expense, protecting your margins and your eventual exit multiple.