
The practical answer
- Short answer
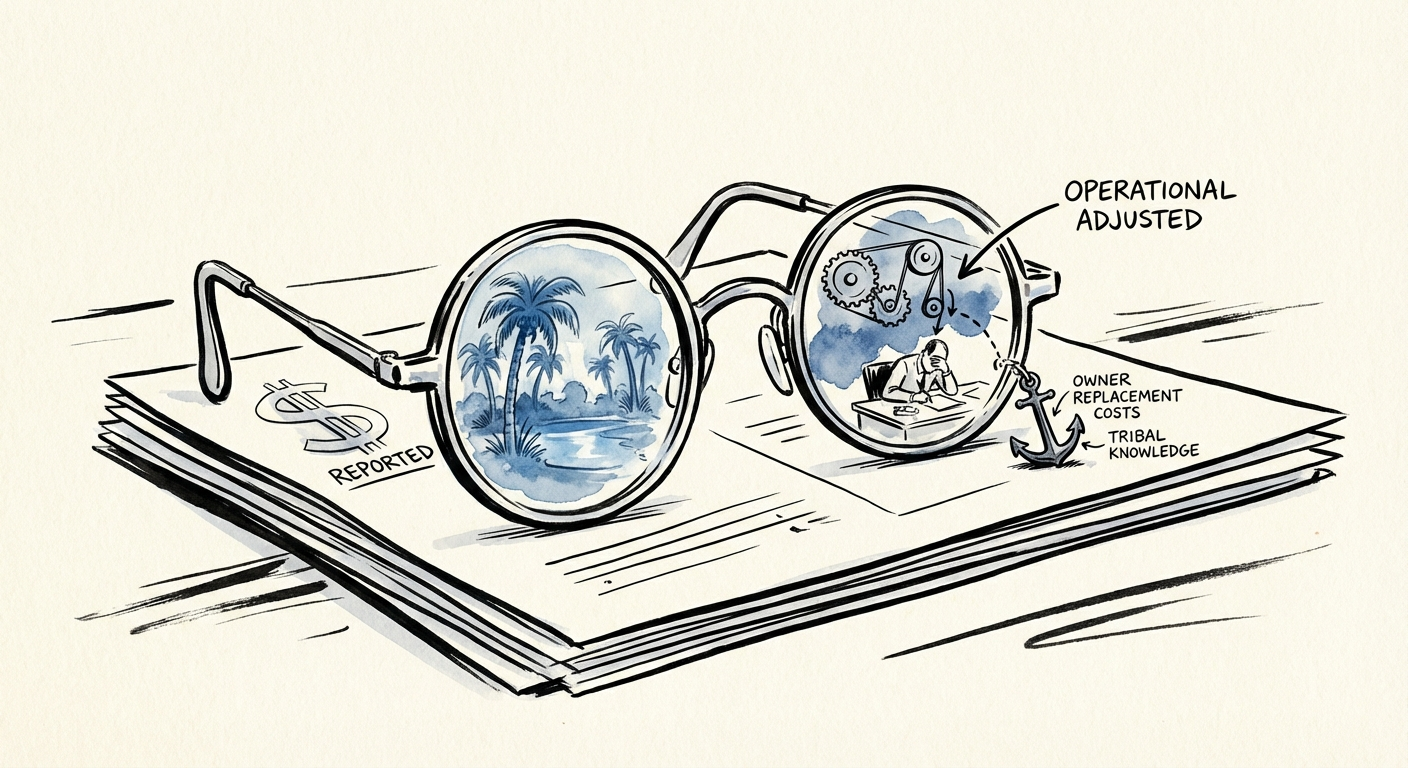
- A QoE report verifies what was spent. It misses what the founder isn't paying for. Here's how to recalculate a services firm's Adjusted EBITDA before you sign.
- Best fit
- Industry: Professional Services. Function: Finance & Operations
- Operating path
- Exit Readiness → Operational Excellence → Transaction Advisory Services
- Key metric
- 9.4x Q3 2025 Lower Middle Market EV/EBITDA Multiple (Rebounding from 7.3x)
The add-back schedule that reads like a confession
A founder slides a one-page Adjusted EBITDA bridge across the table. Reported EBITDA: $3.1M. After add-backs: $5M. The bridge is clean, the line items are reasonable on their face, and your associate is already running it at the Q3 2025 lower middle-market average of 9.4x. That's a $47M enterprise value. It's also where most services deals quietly go wrong.
Here's the part the schedule won't tell you. The same multiple that makes the deal exciting makes every error catastrophic. At 9.4x, a $100,000 expense the founder normalized away that shouldn't have been doesn't cost you $100,000 — it costs you roughly $940,000 in price. Three sloppy add-backs and you've overpaid by the price of a senior delivery team. And rebounding multiples (up from 7.3x earlier in the cycle, per Diamond Capital Advisors' Q3 2025 lower middle-market update) only widen that blast radius.
The trap with a consultancy, MSP, or agency is that there's nothing to kick the tires on. No machines to appraise, no patents to value, no contracted SaaS ARR with a renewal curve. The asset walking out the door at 6pm is the asset. So when a founder shows you $5M of earnings, they are usually showing you a number built on three assumptions that hold only while they personally are still in the building: that their own labor is free, that signed work equals delivered work, and that running on memory instead of process is a margin advantage rather than a deferred bill. A standard Quality of Earnings report will scrub the country-club dues and the leased SUV. It will not touch any of those three. Your job is to recalculate the number the QoE can't.
In a services firm, EBITDA isn't what's left after expenses. It's the cash a system produces once the founder walks out the door. If the system doesn't exist, you're not buying earnings. You're buying a payroll obligation with a multiple attached.
Three add-backs a QoE won't challenge — and how to reprice them
Financial diligence answers "what was actually spent?" Operational diligence answers "what will it cost to run this without the founder?" The gap between those two questions is where a services firm's real EBITDA lives. Three line items decide it.
1. The founder isn't one hire — they're three
The classic move: a founder pays themselves $150,000, adds back nothing, and calls it market rate. It isn't. By 2025 benchmarks, the loaded cost to replace a non-founder CEO of a $20M–$50M services firm runs $500,000 to $625,000 in total compensation (consistent with the executive ranges in KPMG's 2025 compensation benchmark work). But the deeper problem is that the founder of a 40-person agency is rarely just the CEO. They're also the rainmaker closing the top accounts and the senior architect the team escalates to when a delivery goes sideways.
So model three replacements, not one. Walk the org chart and ask, role by role: when this person leaves, who does this? If the honest answer is "we'd have to hire someone," that salary is a deduction from EBITDA, not an add-back to it. A founder taking $150K who is genuinely doing the work of a CEO, a VP of Sales, and a principal consultant is hiding $400K–$600K of structural cost. That's key-person risk expressed in dollars, and it lands on your P&L the quarter they vest out.
2. Signed is not delivered — find the phantom backlog
In services, revenue recognition bends toward whatever flatters the quarter. The pattern to hunt for in 2025 is what we call phantom backlog: fixed-price engagements that are signed and booked but stalled because the firm sold more than it can staff. Don't trust the invoice register. Tie recognized revenue to timesheets and delivery milestones. If a meaningful slice of "revenue" sits in fixed-price projects already running over budget, that isn't revenue — it's a cost-to-complete liability wearing a revenue label. Estimate the remaining hours to finish those engagements at fully loaded delivery cost and deduct it. A firm that booked the win but hasn't done the work has sold you a deficit.
3. The tribal-knowledge tax comes due in year one
A firm that runs on what's in three senior people's heads posts artificially high margins, because it has never paid for documentation, onboarding, or repeatable process. It delivers on heroics. Those margins are real today and gone the moment a key person quits or you try to scale headcount. Price the documentation deficit directly: a firm with no SOPs typically needs $250K–$500K in the first year to build them, and even then you eat a productivity dip while the team adjusts to working from a system instead of from memory. We normalize EBITDA down by 3–5% for firms with low process maturity to reflect that drag. (For context on how thin services margins already are against asset-heavy sectors, the comps in Axial's 2025 EBITDA multiples by industry are worth holding next to your model.)
A five-day test you can run before exclusivity
Run the three adjustments above and the $5M business is frequently a $3.2M business carrying an earnout liability. That's not a reason to walk — it's a reason not to pay 9.4x for a number that doesn't survive the founder's exit. Before you sign the LOI, give your team five days and three asks:
- Re-slice the P&L by project and by client, not by GL code. A healthy services firm can produce this in an afternoon. If they can't, assume the margin you're looking at is a blend that's hiding loss-making accounts you'll inherit on day one.
- Stress-test the top five revenue generators. Identify the five people responsible for the most billings. Model the loss of any two of them post-close. If that wipes out more than 20% of EBITDA, your concentration risk is the deal's central question, and your retention package and earnout structure have to answer it.
- Quantify the platform. For tech-enabled services, decide whether the proprietary tooling is a value driver or a maintenance liability waiting to surface. Put a number on the technical debt the same way you'd put one on a roof that needs replacing.
You're not there to ratify the CIM. You're there to pressure-test the engine that produces the earnings and decide what it's worth once the person who's been holding it together is gone. Get the operational number first. Then negotiate against it — not against the founder's bridge.