The practical answer
- Short answer
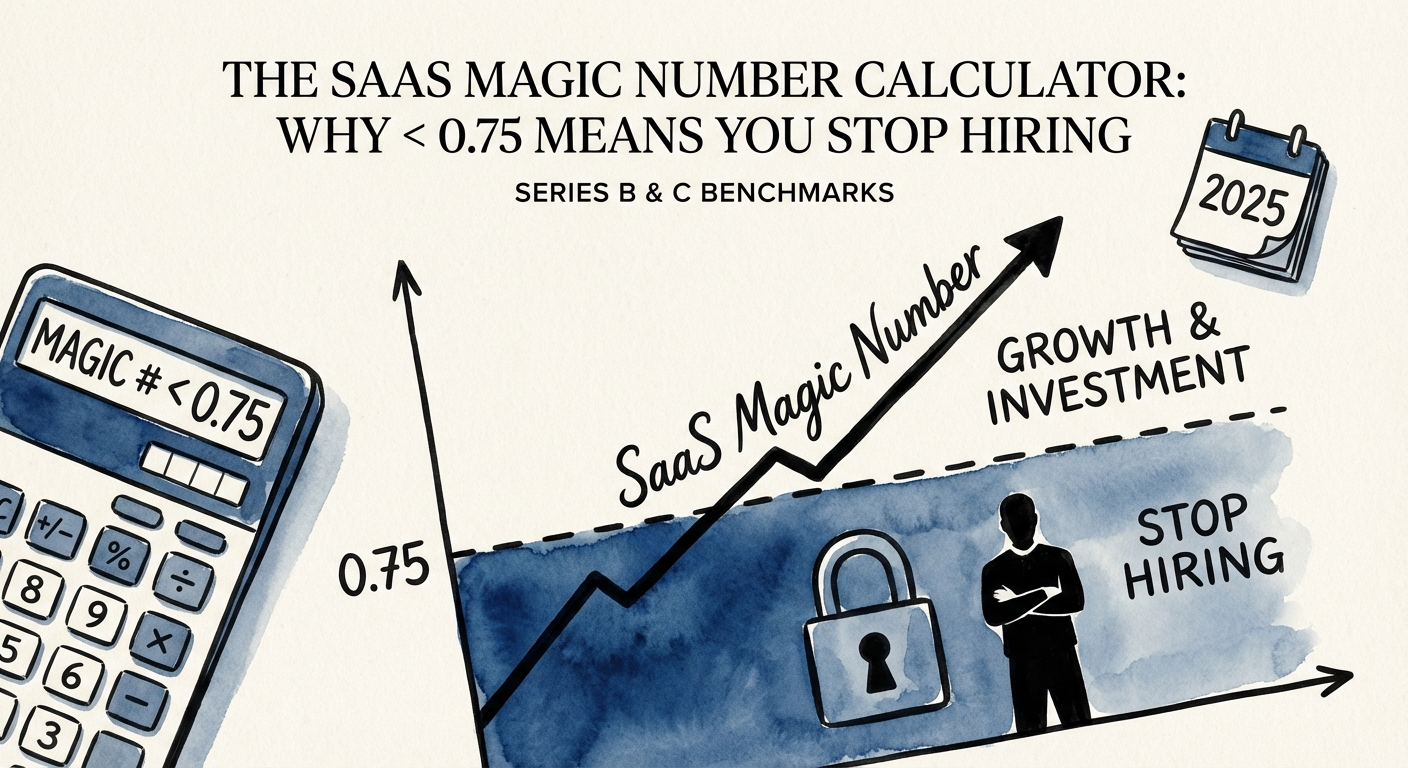
- The SaaS Magic Number formula, plus what's good: above 1.0 means pour fuel, 0.75-1.0 is healthy, below 0.75 stop hiring. With 2025 benchmarks by stage.
- Best fit
- Industry: B2B SaaS. Function: Revenue Operations
- Operating path
- Unit Economics → Commercial Performance → Transaction Advisory Services
- Key metric
- 0.75 The 'Low Water Mark' for SaaS Magic Number in 2025. Below this, stop hiring.
What the SaaS Magic Number Is — and What Counts as "Good"
The SaaS Magic Number tells you how much new annual recurring revenue (ARR) you generate for every $1.00 of sales and marketing spend. The formula is simple: annualized net-new ARR divided by the prior quarter's S&M expense. Above 1.0, the machine works and you should pour fuel; 0.75 to 1.0 is healthy; below 0.75, you are buying revenue at a loss and should stop hiring reps. Here is how to calculate it, benchmark it against 2025 data, and act on the score.
For the better part of a decade, the instruction manual for Series B and C founders was simple: burn cash to buy growth. If you spent $2 million on Sales and Marketing (S&M) to generate $1 million in Net New ARR, nobody blinked. The valuation markets rewarded top-line velocity, and efficiency was a problem for "future you."
That future has arrived, and it brought a calculator.
In 2025, the market has shifted from rewarding raw growth to rewarding efficient growth. We see this in the collapse of revenue multiples for high-burn companies and the stabilization of the "Rule of 40." For founders—stuck on a revenue plateau while costs balloon—the most critical question isn't "how do we grow faster?" It's "is our growth engine actually broken?"
The diagnostic tool for this specific problem is the SaaS Magic Number. Unlike CAC Payback (which looks at individual unit economics) or LTV/CAC (which relies on shaky 5-year retention assumptions), the Magic Number is a real-time pulse check on your entire Go-To-Market (GTM) machine. It tells you exactly how much Annual Recurring Revenue (ARR) you create for every $1.00 of Sales and Marketing expense.
If you don't know this number, you lack the operating visibility to steer. If you do know it, and it's below 0.75, you are likely burning equity faster than you are building value. Here is how to calculate it, benchmark it, and fix it.
If your Magic Number is low (< 0.7), think about whether or not you need to make changes to your go-to-market model... Conversely, if your Magic Number is high (> 0.7), think about stepping on the gas.
The Magic Number Formula & 2025 Benchmarks
The beauty of the Magic Number is its brutality. It doesn't care about your "strategic brand awareness" campaigns or your "pipeline coverage." It only cares about dollars in vs. dollars out.
The Standard Formula
While the original definition used GAAP revenue, most operators and PE firms run this calculation using ARR for a clearer operational view:
Magic Number = (Current Qtr ARR - Previous Qtr ARR) × 4 / Previous Qtr S&M Expense
The Logic: You take the net growth in ARR from the quarter, annualize it (multiply by 4), and divide it by what you spent on Sales and Marketing the previous quarter to generate that growth. (Note: Using the previous quarter's spend accounts for the typical sales cycle lag).
The 2025 Benchmarks: What Good Looks Like
According to Scale Venture Partners and recent 2025 data, the bar for efficiency has bifurcated. AI-native companies are setting new records, while traditional SaaS firms struggle to hold the line.
- > 1.0 (The Green Light): You are generating over $1.00 of ARR for every $1.00 spent. This is highly efficient. The market signal here is "Pour Fuel." You should aggressively hire sales reps and increase marketing spend because your machine is working.
- 0.75 – 1.0 (The Yellow Zone): This is the new median for healthy Series B/C companies. You are growing efficiently enough to be sustainable, but there is friction in the system. You can hire, but cautiously.
- < 0.75 (The Red Zone): You are buying revenue at a loss. For every dollar you spend, you get less than 75 cents of recurring revenue back. Stop hiring. Do not add more reps to a broken system.
- < 0.5 (The Death Zone): You are burning cash with almost no return. This typically signals a fundamental product-market fit issue or a catastrophic churn problem.
It is worth noting that Private Equity (PE) backed firms often target a Magic Number above 1.2, achieved not just by growing faster, but by rigorously cutting unproductive marketing spend. Conversely, ICONIQ Growth's 2025 report highlights that "AI-native" companies are achieving Magic Numbers well above 1.5 due to leaner headcounts and product-led growth (PLG) motions.
The "Churn" Trap
The standard formula uses Net New ARR. This means high churn can mask good sales performance. If your sales team added $2M in new bookings, but you lost $1.5M in churn, your Net New is only $0.5M. Your Magic Number will plummet, making it look like a sales problem when it is actually a Customer Success problem. Always calculate a "Gross Magic Number" (using Gross New ARR) alongside the Net version to isolate the issue.
The Diagnostic: What to Do Based on Your Score
Calculating the number is 5% of the work. The other 95% is the operational response. If you are a founder dealing with a Magic Number below 0.75, you cannot simply "push harder." You must re-engineer the machine.
Scenario A: Magic Number < 0.5 (The Freeze)
The Diagnosis: Your GTM motion is fundamentally broken. You are likely staffing a heavy enterprise sales team to sell a product with SMB price points, or your marketing CAC is out of control.
The Action Plan:
- Immediate Hiring Freeze: Cancel all open recs for AEs and SDRs. Adding headcount here accelerates burn, not growth.
- Churn Audit: Is the leak in the bucket (retention) or the faucet (acquisition)? If NRR is < 100%, fix the bucket first. See our guide on fixing NRR and Rule of 40.
- Segment Analysis: Calculate the Magic Number by segment. You may find your Mid-Market team is at 0.9 while Enterprise is at 0.2. Kill the inefficient segment.
Scenario B: Magic Number 0.5 – 0.8 (The Tune-Up)
The Diagnosis: You have product-market fit, but your friction costs are too high. This is common in Series B companies where "founder heroics" have been replaced by average sales reps who lack the founder's closing ability.
The Action Plan:
- Shorten the Cycle: Look at your CAC Payback Period. Can you remove a stage from the sales process? Can you automate the demo?
- Raise Prices: The fastest way to improve efficiency is to increase Average Contract Value (ACV) without increasing S&M spend. A 10% price hike drops straight to the Magic Number.
- Marketing Attribution: Cut the bottom 20% of marketing spend that cannot be directly tied to pipeline. Brand ads are a luxury for companies with a Magic Number > 1.0.
Scenario C: Magic Number > 1.0 (The Scale)
The Diagnosis: You are leaving money on the table. You have a verified machine that turns $1 into $1.20+. Investors will punish you for not growing faster in this scenario.
The Action Plan:
- Double Down on Channels: Whatever channel is working (e.g., LinkedIn Ads, Outbound), double the budget immediately until efficiency drops to 0.9.
- Hire Aggressively: This is the only time you should be mass-hiring AEs.
Conclusion
The SaaS Magic Number is the ultimate arbiter of your GTM strategy. It removes emotion from the budgeting process. If the number is low, no amount of narrative will fix it—only operational surgery will. In 2025, efficiency is not just a metric; it is the primary condition for survival.