The "Headline EBITDA" Trap
If you are looking at a Confidential Information Memorandum (CIM) for a \$20M revenue IT services firm, the first number you circle is EBITDA. In 2026, that number is almost certainly lying to you.
We are seeing a massive bifurcation in the market. On paper, two firms might both show \$4M in EBITDA. One trades at 4.5x. The other trades at 12.8x. If you are a PE Operating Partner or a Corporate Development officer, the difference isn’t in the accounting—it’s in the operational engineering.
The era of buying generic "consulting capacity" is over. The 2025-2026 market has shifted aggressively toward what I call the Transferability Premium. Buyers are no longer paying for a founder's Rolodex or a "hero" delivery team that pulls all-nighters. They are paying for systems, intellectual property, and recurring revenue streams that survive the founder's exit.
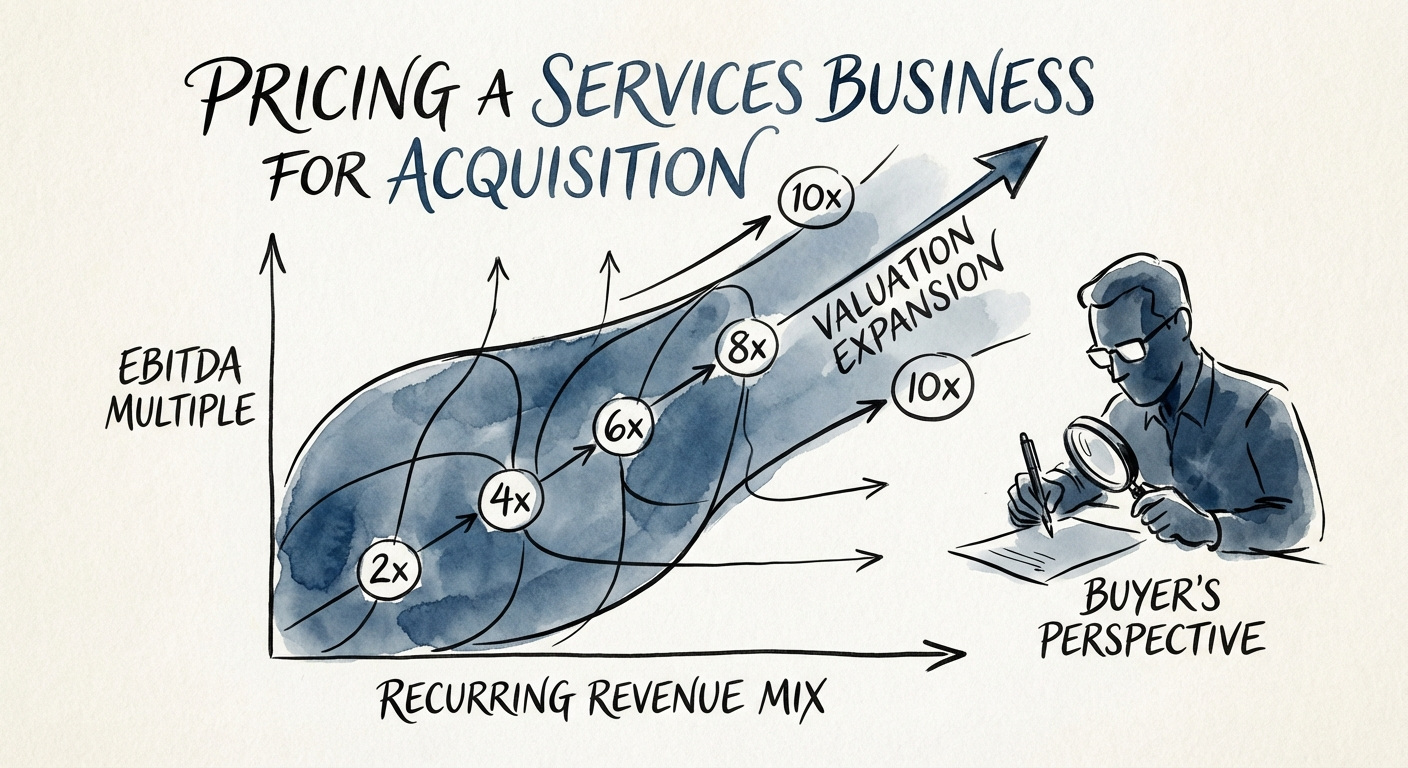
The Multiples Have Split
According to 2025 data, the spread between "project-based" and "recurring" services revenue has never been wider. While median multiples for general IT consulting hover around 9-11x, firms with high "tribal knowledge" dependency (i.e., low documentation, high key-person risk) are being hammered down to 4-5x. Meanwhile, tech-enabled managed services with documented SOPs and >50% recurring revenue are commanding 12x+ premiums.
Your job isn't just to check the Quality of Earnings (QoE) report from the accountants. It's to conduct a Quality of Operations audit. You need to identify if you are buying a business or just a group of expensive contractors sharing a Slack channel.
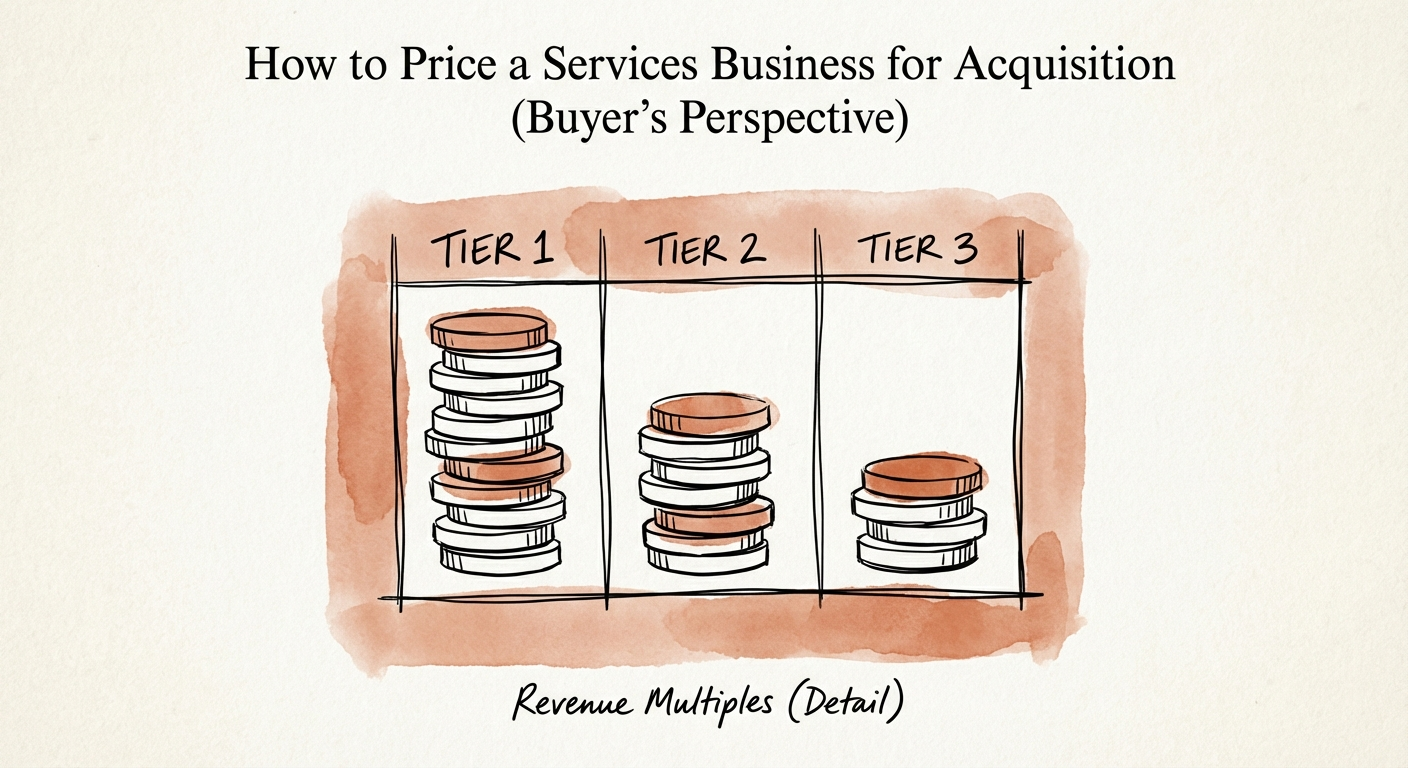
The Three Tiers of Revenue Quality
To price a services business accurately, you must strip the P&L down to its constituent revenue types. We categorize revenue into three tiers, each commanding a drastically different multiple.
Tier 3: Project Revenue (The 4x Bucket)
This is "eat what you kill." It’s one-off implementations, staff augmentation, or time-and-materials work. It’s valuable for cash flow, but high-risk for valuation if it exceeds 40% of the mix. Why? Because every January 1st, the revenue counter resets to zero. You have to re-win the business every year.
- Valuation Impact: 0.8x - 1.2x Revenue (4x - 6x EBITDA).
- The Risk: High volatility, extreme dependency on sales "rainmakers."
Tier 2: Re-Occurring Revenue (The 7x Bucket)
Often confused with recurring revenue, this is repeat business that isn't contractually guaranteed. Think of a marketing agency where the client usually renews, or an IT firm that is the "preferred vendor" for a Fortune 500. It looks stable, but it relies on relationships, not contracts.
- Valuation Impact: 1.5x - 2.0x Revenue (7x - 9x EBITDA).
- The Risk: Customer concentration often hides here. If the champion leaves the client account, the revenue vanishes.
Tier 1: Contractual Recurring Revenue (The 12x Bucket)
This is the holy grail: Managed Services, multi-year retainers, or IP-based licensing. This revenue shows up whether the founder gets out of bed or not. In 2025, private equity buyers paid an average of 12.8x EBITDA for assets with a dominant Tier 1 mix, compared to just 8.6x for corporate buyers targeting generic assets.
The "Debt" Adjustments Nobody Checks
Beyond revenue mix, you must adjust the purchase price for Operational Debt. Standard financial QoE adds back one-time expenses. You need to subtract future costs required to fix the engine.
- Tribal Knowledge Debt: If processes aren't documented, you will pay a "training tax" of 20-30% efficiency loss post-acquisition. Deduct the cost of documenting the firm’s core IP.
- Technical Debt: In tech services, auditing the code or infrastructure is critical. If the previous owner underinvested in internal tooling to boost margins, you’re buying a latent risk.
The Valuation Matrix: Actionable Benchmarks
When constructing your Letter of Intent (LOI) or defending your exit price, use this matrix. It moves the conversation from "gut feel" to defensible data.
The 2026 Adjustments List
Start with the TTM (Trailing Twelve Months) EBITDA. Then apply these adjustments based on operational reality:
- Over 50% Recurring Revenue: Add 1.5x - 2.0x to the multiple.
- Customer Concentration (>20% from one client): Deduct 1.0x - 2.0x. This is a non-negotiable risk discount.
- Founder-Led Sales Dependency: If the founder generates >40% of new business, deduct 1.5x. You will need to hire a VP of Sales (expensive) and accept a ramp period (risky).
- Churn Rate >15%: Deduct 1.0x - 3.0x. High churn in a services business indicates a delivery problem, not just a sales problem.
Conclusion: Buy the Engine, Not the Driver
The days of financial engineering are largely behind us. You cannot just strip costs and arbitrage the multiple anymore. The winners in the 2026 vintage are pricing businesses based on their operational maturity.
If you are a seller, your goal is to move revenue from Tier 3 to Tier 1 and document every process before you go to market. If you are a buyer, your edge lies in identifying firms where the "Headline EBITDA" is suppressed by fixable operational inefficiencies—and avoiding the ones where the EBITDA is propped up by heroics.
Price the business on its ability to run without you. That is the only multiple that matters.