
The practical answer
- Short answer
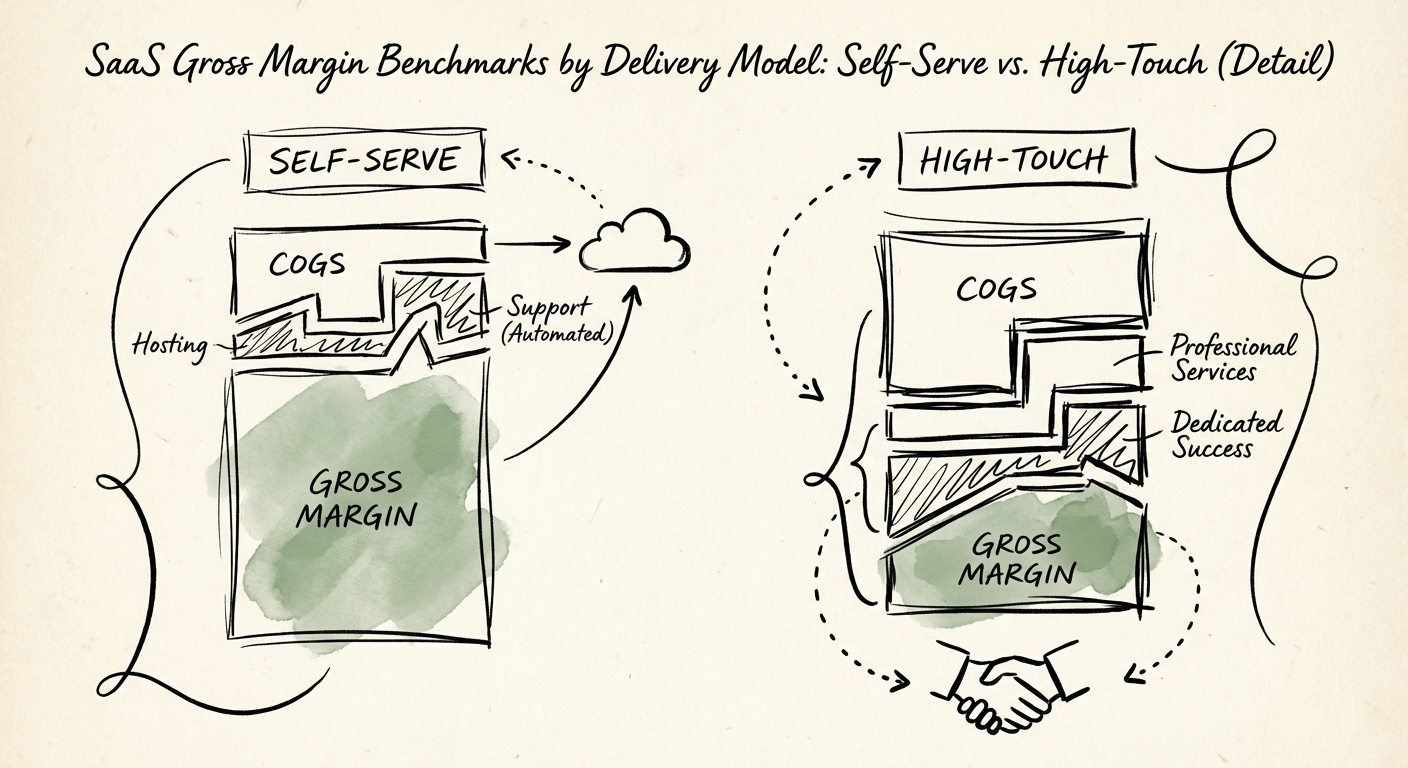
- Self-serve SaaS clears 80–85% gross margin; high-touch runs 70–75%; AI-native just 50–60%. The 8-point subscription-vs-total spread, and how to fix it.
- Best fit
- Industry: B2B SaaS. Function: Finance & Operations
- Operating path
- Unit Economics → Commercial Performance → Transaction Advisory Services
- Key metric
- 71% Median Total Gross Margin (Private SaaS)
The 80% Myth That Is Killing Your Valuation
If you are reading the headline summaries of public SaaS reports, you are likely chasing a ghost. You see Atlassian or Adobe posting 85%+ gross margins and assume that is the standard. When your Finance Director slides a P&L across your desk showing 68%, you panic. You start slashing server costs. You squeeze the AWS bill. You yell about code efficiency.
You are solving the wrong problem.
For a Founder (Series B/C), the gap between your gross margin and the industry “gold standard” is rarely about hosting costs. It is about Delivery Model Architecture. The most dangerous number in SaaS isn't the churn rate; it's the blended gross margin that hides the cost of your “white glove” service.
We analyzed data from the 2024 KeyBanc SaaS Survey and 2025 ICONIQ reports to uncover the truth: while the median Subscription Gross Margin hovers around 79%, the median Total Gross Margin (including services and onboarding) drops to 71%. That 8% spread represents millions in EBITDA for a $20M ARR company.
If you are running a High-Touch Enterprise model but pricing like a Self-Serve PLG tool, you aren't just missing margin—you are actively subsidizing your customers' operations with your own equity.
You cannot be a 'White Glove' service with 'Freemium' economics. The middle ground is where margins go to die.
The Data: Self-Serve vs. High-Touch Economics
Your gross margin is the ceiling of your profitability. You cannot OpEx your way out of a COGS problem. To fix it, you must first benchmark against your actual delivery model, not a generic industry average.
1. The Benchmark Reality
Recent data reveals a bifurcation in the market. The “Rule of 80” (80% GM) is largely the domain of Product-Led Growth (PLG) and pure-play software. High-Touch models face a different reality.
- Pure PLG / Self-Serve: 80-85% Gross Margin.
Primary COGS: Hosting, Payment Processing, Automated Support Infrastructure. - Enterprise / High-Touch: 70-75% Gross Margin.
Primary COGS: Hosting, Customer Success (Implementation), Professional Services, DevOps Support. - AI-Native SaaS: 50-60% Gross Margin.
Primary COGS: GPU Compute, Inference Costs, Third-Party Model APIs.
According to KeyBanc's 2024 SaaS Survey, the median Total Gross Margin for private SaaS companies is 71%. If you are below 70%, investors view your cost structure as “broken,” regardless of your growth rate.
2. The “Service Wrap” Trap
The most common reason for margin erosion in High-Touch models is misclassification. Founders often treat onboarding and implementation as “part of the sale” (CAC) rather than “part of the product” (COGS).
If your Customer Success Managers (CSMs) are spending 40% of their time troubleshooting technical issues or manually onboarding users, that 40% is COGS. By burying it in Sales & Marketing, you inflate your Gross Margin artificially, but your bank account knows the truth. As noted in our analysis of hidden margins in delivery models, this “shadow services” layer can bleed 26% of your revenue without showing up on the standard P&L.
3. The AI Tax
For companies integrating AI, the math changes again. CloudZero reports that AI workloads, specifically LLM inference, are becoming a hidden margin killer in 2025. Unlike traditional SaaS code, where marginal cost approaches zero, AI features have a linear (or sometimes exponential) cost per usage. If you add “GenAI Magic” to your High-Touch platform without raising prices, you are effectively paying your customers to use your product.
The Operator's Action Plan: Fixing the Margin
You don't need to fire your support team to fix your margins. You need to align your pricing and packaging with your delivery reality. Here is the 90-day margin recovery playbook.
Step 1: Audit Your COGS Misclassification
Stop lying to yourself. Move the following expenses “above the line” into COGS:
- CSM time spent on onboarding/training (not renewal/upsell).
- DevOps time spent on single-tenant maintenance or customer-specific deployments.
- Third-party API costs (including OpenAI/Anthropic bills) directly triggered by user action.
This will likely drop your reported GM by 5-10 points. Good. Now you have a baseline to improve.
Step 2: Monetize the High-Touch
If your model requires hand-holding, stop giving it away. Enterprise buyers expect to pay for implementation. If you have a High-Touch cost structure but a Self-Serve price point, you will fail. Introduce a mandatory “Platform Fee” or “Implementation Package” that covers the human cost of delivery. This shifts margin pressure away from your subscription revenue.
Step 3: The “Deflection” KPI
For High-Touch companies, the goal isn't to eliminate humans; it's to reserve them for high-value work. Track Ticket Deflection Ratio. If you can use in-app guides (WalkMe, Pendo) or AI bots to handle Tier 1 requests, you protect your margins. Read more on gross margin expansion levers to see how elite firms automate the mundane to afford the exceptional.
Conclusion
Your delivery model dictates your margin potential. You cannot be a “White Glove” service with “Freemium” economics. Embrace your model. If you are High-Touch, charge for the touch. If you are Self-Serve, automate the service. The middle ground is where margins go to die.