The practical answer
- Short answer
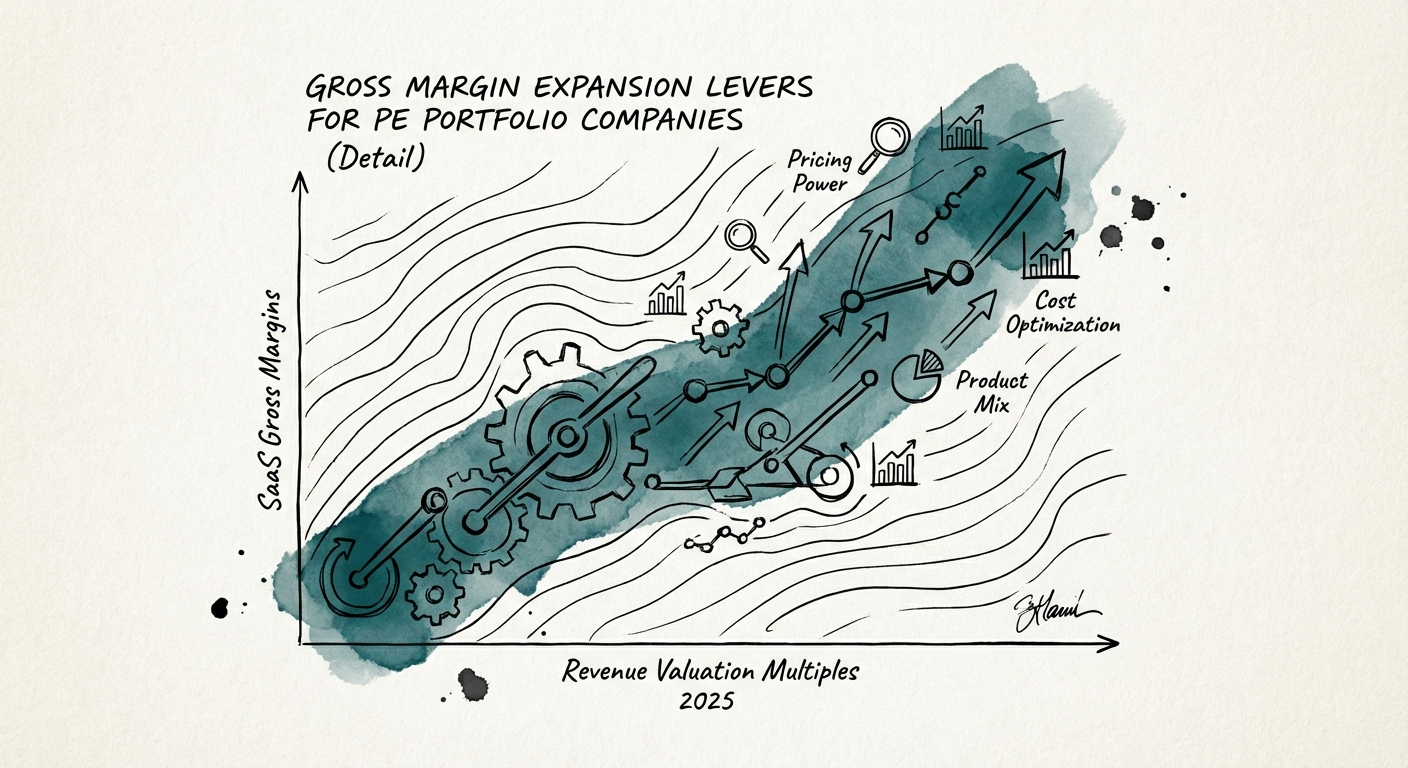
- The CIM said 78% gross margin. The first monthly pack says 62. Here's how PE operators bridge the gap on a B2B SaaS asset, line by line, before the next raise.
- Best fit
- Industry: B2B SaaS. Function: Operations
- Operating path
- Unit Economics → Commercial Performance → Transaction Advisory Services
- Key metric
- 105% Valuation premium for SaaS firms with >80% Gross Margins (Software Equity Group, 2025)
The number that didn't survive the first board cycle
The CIM said 78. Your IC underwrote to 78. Then the first clean monthly pack lands after close, and the gross margin line reads 62. Nobody lied to you — they just defined "cost of revenue" generously and let a year of 25% growth paper over the rest. You bought what looked like a software company. What you actually own is a B2B SaaS asset with a services business stapled to its side and a cloud bill nobody owns.
This gap is no longer survivable on the way to exit. The era when growth bought forgiveness for margin is gone. Software Equity Group's 2025 read on the public comps puts the spread starkly: SaaS companies carrying gross margins above 80% trade at roughly a 105% valuation premium over their lower-margin peers. That is not a rounding difference on your model — it is the difference between a strategic auction and a quiet sale to whoever will still pick up the phone.
Here is the part operators underweight: a 62% gross margin is not just a lower multiple input. It is a signal. The moment a buyer's diligence team sees it, they know exactly where to dig — the customer-success payroll, the AWS console, the legacy contract book. They will find your hidden services arm in an afternoon and they will price the cleanup against you. The work below is about getting to that finding first, on your own clock, while it still reads as a value-creation thesis instead of a markdown.
A 62% gross margin doesn't just lower your multiple — it tells the buyer's diligence team exactly where you didn't look. They will find it in an afternoon, and they will price it.
Build the bridge before you build the plan
Skip the abstract "levers." On a SaaS asset stuck in the low 60s, the missing ~16 points almost always sit in three buckets, and you can size each one in a week. Build the bridge first — current GM, plus the recoverable points in each bucket — then you know where to spend management attention.
Bucket one: cloud sitting in COGS, unmanaged. Most PE-backed SaaS assets treat the AWS or Azure bill as a fixed utility. It is the opposite — it's the most variable, most recoverable cost you own. IDC's 2025 work, summarized by EverythingCloud, pegs nearly 30% of cloud spend as wasted on over-provisioning and absent governance. But the deeper tell is architectural. If onboarding a new logo spins up a dedicated database or a fresh instance, you bought single-tenant infrastructure wearing a multi-tenant price tag — and that COGS line will rise in lockstep with revenue forever. The fix isn't a reserved-instance shopping spree; it's making per-customer compute cost a number engineering reports on every sprint.
Bucket two: customer success that is actually unpaid delivery. When a SaaS asset prints below 70% gross margin, the CS team is usually a services arm in disguise — building custom reports, hand-migrating data, cleaning records the product should have validated. That labor lands in COGS and quietly poisons the blended number. The benchmark you are measuring against is real: RockingWeb's 2025 metrics report puts pure-play SaaS gross margin at a 77–79% median, with the top quartile above 85%. A legitimate services line is fine — but it has to be invoiced separately and run at 40%-plus on its own. Blend it into the subscription and you don't get a software multiple on either half.
Bucket three: AI features priced like a giveaway. AI is a margin trap dressed as a margin story. The premium is real — Monetizely's 2025 pricing data shows AI-enhanced capabilities can command a 60–85% price uplift — but the inference compute can drag a feature's margin down to 65–72% if it ships inside the base license. The discipline is packaging: high-compute AI capability lives in a defined upper tier where the price covers the GPU bill, never bundled into the entry SKU where it silently eats your floor.
The decision you actually face this quarter
The temptation is to launch all three workstreams Monday. Don't — you'll spook the team and blur the read. Sequence them so each month produces one number the board can underwrite.
Month one — tag the COGS. Have the CFO and CTO instrument the cloud bill so every line ties to a customer cohort. The output you want is a single chart: compute cost attributable to your top 10% of accounts. You will frequently learn your largest logos are your least profitable, which reframes the renewal conversation entirely and is the same dynamic that drives concentration-risk valuation math. This month moves no margin — it tells you which of the next two months matters more.
Month two — reset the service boundary. Audit where CS hours actually go. Anything resembling implementation, migration, or custom reporting moves to a paid statement-of-work. Yes, this surfaces churn risk you were previously subsidizing — that is the point. You need the true health of the core product to be visible before you price it. For what a healthy services-delivery margin looks like underneath, the MSP gross-margin benchmarks are a useful floor.
Month three — reprice and repackage. Roll an annual uplift on renewing contracts, introduce a maintenance fee for customers parked on legacy versions, and ship the AI tier that captures expansion from your power users without diluting the blend. Done in order, you walk into the next board meeting with a margin bridge that reads as a thesis, not a confession — and you've taken the cleanup off the buyer's diligence list and put it in your own value-creation column. A 62% asset gets diligenced as a consultancy. An 80% asset gets auctioned as a platform. The work between those two numbers is mechanical, and it is yours to do now.