
The practical answer
- Short answer
- 2025 MSP benchmarks: median firms run 12.2% EBITDA while best-in-class hit 19%+. Why the top quartile earns 2.5x the bottom line, and how to close the gap.
- Best fit
- Industry: Managed Services / IT Services. Function: Finance & Operations
- Operating path
- Unit Economics → Commercial Performance → Transaction Advisory Services
- Key metric
- 46.2% Average managed services gross margin (Q2 2024)
The Median Trap in Managed Services
If your portfolio's Managed Services Providers (MSPs) are hovering around 10-12% EBITDA, you are leaving massive value on the table. The gap between "good" and "great" in this sector is not subtle; it is existential. Recent data from Q2 2024 reveals that while the median MSP struggles with low double-digit margins, Private Equity-backed MSPs are hitting an average of 18.7% Adjusted EBITDA.
The culprit is almost always Service Delivery Gross Margin (SDGM). Revenue growth has slowed across the industry (down to ~10% organic growth from post-COVID highs), meaning the "grow your way out of inefficiency" playbook is dead. You cannot acquire enough revenue to fix a broken service factory. If your labor COGS are bloated, every new dollar of revenue brings diminishing returns to the bottom line.
For a PE operating partner, the diagnostic is simple: ignore the top-line vanity metrics. Look immediately at the Gross Margin of your recurring revenue. If it is below 45%, your technicians are inefficient, your tooling is underutilized, or your pricing model is detached from reality.
In an MSP rollup, the gap between a 3x and a 5x return isn't a better salesperson. It's the gross margin in the service-delivery engine. Measure it, benchmark it, and automate it.
The Numbers: 2025 MSP Margin Benchmarks
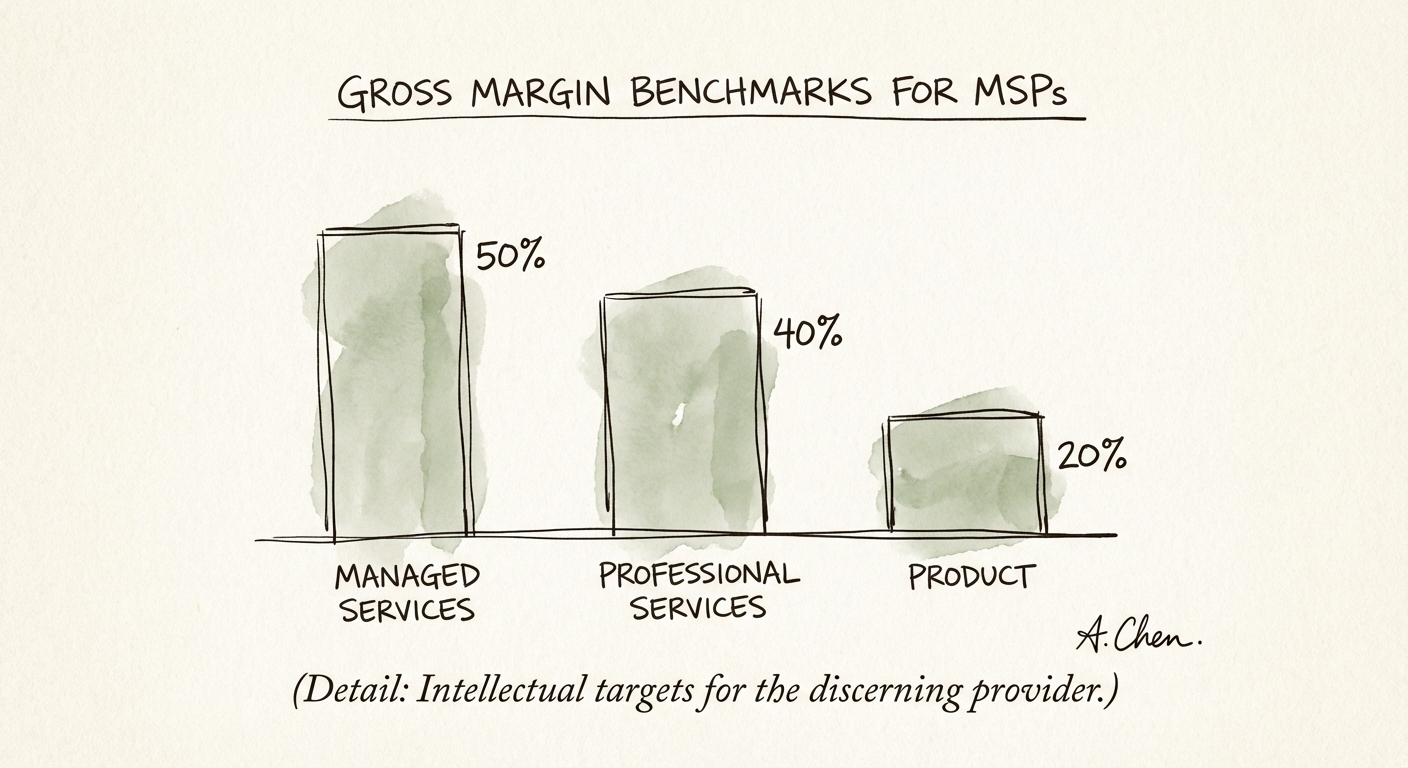
To standardize operations across a rollup, you need rigid benchmarks. Based on 2024-2025 data from Service Leadership and industry reports, here is the scorecard you must enforce:
- Best-in-Class Managed Services Gross Margin: Target 50%+. (The industry average recently ticked up to 46.2%, but top performers consistently break 50%.)
- Professional Services Gross Margin: Target 40-45%. (Warning: this has recently dipped industry-wide to ~19.4% due to utilization dragging. Fix this immediately.)
- Product/Resale Gross Margin: Target 15-20%. (Do not let this dilutive revenue distract from the core valuation driver.)
- Adjusted EBITDA: Target 19-20%.
The Automation Factor
Why are the top 25% of firms performing 2.5x better than the median? Hyperautomation. We are seeing a "curve jump" where best-in-class MSPs are using AI and rigid SOPs to decouple revenue growth from headcount growth. Data indicates that automation can reduce ticket resolution times by 40% and cut operational expenses by up to 30%. If your MSP adds a technician for every $150k in new ARR, you are failing. The new standard is scaling revenue without linearly scaling labor.
Action Plan: Fix the Factory
Standardization is not a buzzword; it is the only path to that 18.7%+ EBITDA target. Here is your immediate execution roadmap:
1. Audit the "W2 Multiple"
Calculate your Service Multiple of Wages. How much recurring revenue does each dollar of service labor generate? If this multiple is stagnant, your automation tools (RMM, PSA) are shelfware. Force adoption or switch stacks.
2. Automate Tier 1
Routine tickets (password resets, user creation) must be zero-touch. Implement AI-driven ticketing to intercept 20% of inbound volume before it touches a human. This directly impacts your Managed Services Gross Margin.
3. Normalize Pricing
Stop custom-scoping every deal. Enforce a standardized seat-price model across all portfolio companies. You cannot benchmark margins if every portfolio company sells a different "stack" at different margins.
Conclusion: The difference between a 3x and 5x return on your MSP rollup is not finding a better sales guy. It is fixing the gross margin in the service delivery engine. Measure it, benchmark it, and automate it.