The practical answer
- Short answer
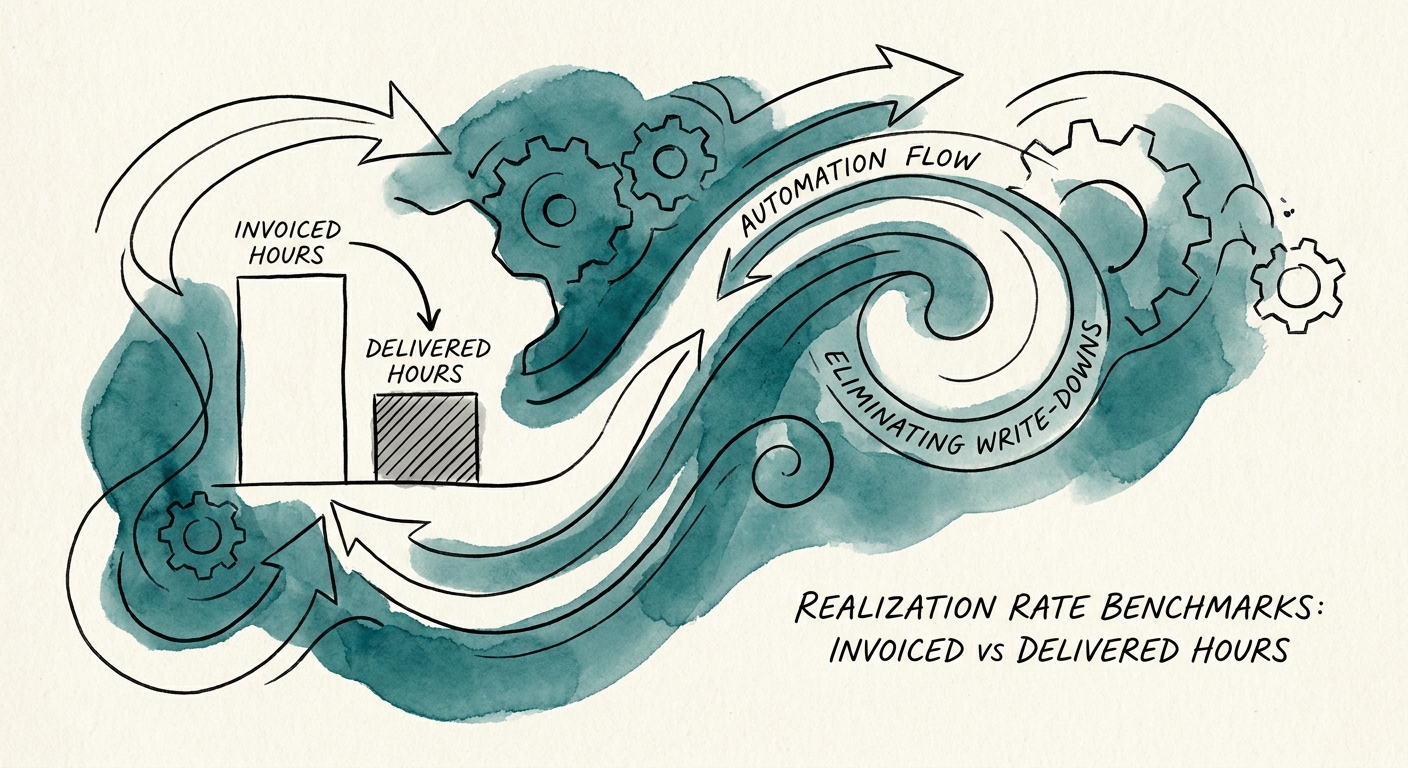
- Your engineers logged 82% utilization. Your firm realized 71%. Here's where IT services revenue leaks between delivered and invoiced hours, and how to close it.
- Best fit
- Industry: Professional Services. Function: Finance & Operations
- Operating path
- Unit Economics → Commercial Performance → Transaction Advisory Services
- Key metric
- 11% Billable time written down by engagement managers before reaching the client invoice.
The 82% that was really 71%
On a recent operational review of a $45M IT services roll-up, the bench looked enviable. Utilization across the engineering group sat at 82%. The legacy leadership treated that number like a trophy. Then we tied the time-tracking system to the general ledger and ran the only comparison that matters: hours actually invoiced over hours actually delivered. Realization came back at 71%. Eleven points of work, performed and logged, that no client ever paid for.
That gap is the difference between a busy firm and a profitable one. Utilization tells you the bench is moving. Realization tells you whether the movement converts to collectible revenue and durable gross margin. An engineer billing 40 hours a week against a project capped at 30 isn't a productivity win. Those extra 10 hours are pure negative margin, and they accrue every single sprint until someone reconciles the timesheet against the contract.
The macro picture is not reassuring. Gartner's 2025 IT Services Profitability Benchmark puts average realization across mid-market technology integrators at 82%, a historic low driven by fixed-fee overruns and undocumented scope creep. Read that carefully: the firm above hit the benchmark on utilization and still fell below the floor on the metric that determines its earnings quality. If you are tracking only the first number, you are flying blind on the second. (Utilization has its own deteriorating story, which I unpack in Professional Services Utilization Rate Benchmarks 2025: Why 68.9% Is the New Danger Zone.)
Utilization is the number your team manages. Realization is the number a buyer recomputes. The 11 points between them is enterprise value you handed to your clients for free.
The leak isn't one decision. It's the month-end ritual.
Revenue doesn't escape an IT services firm through one dramatic write-off. It drains through the engagement manager's keyboard on the last business day of the month. The implementation team worked the weekend to hit a go-live milestone and logged the hours honestly. The EM, dreading the scope conversation with a client who's already irritated, quietly trims those hours before the invoice generates and files them under "investment." Nobody escalated. Nobody signed a change order. The margin simply evaporated.
Watch where this concentrates. On fixed-fee implementations and capped time-and-materials contracts, every hour worked past the estimate without a signed addendum is a direct transfer from your EBITDA to the client's project budget. EY's 2026 Professional Services Revenue Leakage Report found managers proactively write down 11% of billable time before it reaches the invoice, recoding the overage as "investment hours" to keep their project dashboards green. The behavior is rational at the individual level and catastrophic at the firm level. Forrester's 2025 Services Organization Health Index attributes 62% of the realization gap in technology implementation firms to exactly this: scope creep that never got documented.
Here is the part that turns a margin problem into a valuation problem. A buyer in a roll-up does not accept your internal margin at face value. They reconstruct it. They pull the delivered hours, the invoiced hours, and the write-down log, and they recompute your true gross margin during quality-of-earnings work, the same mechanics I walk through in quality-of-earnings adjustments that change deal math. The "investment hours" your EM invented don't survive that scrub. And the spread is enormous: HBR's analysis of consulting firm profitability shows firms holding realization above 90% command a 3.2x valuation premium in competitive M&A roll-ups over lower-realization peers. Eleven points of realization isn't a rounding error on a dashboard. It's a different number on your wire at close.
The compounding damage is in capacity planning. When resourcing believes an implementation took 500 hours because that's what got delivered, but sales priced it at 400, every future bid inherits the lie. You quote against fictional capacity and re-sign yourself into the same loss, deal after deal.
Three changes that move realization in one quarter
Start by killing the incentive that pays people to be unprofitable. If a consultant's bonus tier triggers on logged billable hours, you are literally paying them to overrun scope. Decouple it. I've rebuilt this comp structure across three portfolio companies this year, and the move is the same each time: bonuses gate on realized utilization. Hours only count toward the number if the client paid for them. The first quarter is uncomfortable; by the second, the team stops over-logging because there's no longer a reward for it.
Next, give your engagement managers the authority and the script to stop the line. The moment a client requests work outside the statement of work, delivery pauses until there's a signed commercial addendum. No addendum, no engineer-hours. This is the single behavioral change that closes most of the Forrester scope-creep gap, and it requires reframing the EM role from accommodating task-master to commercial operator. They are protecting your margin at the exact point where it's easiest to lose.
Finally, take the human out of the month-end approval. The longer an EM gets to sit with a timesheet, debating and massaging it before invoicing, the more margin disappears into a sympathetic write-down. KPMG's 2026 B2B Pricing and Billing Study found that automating the timesheet-to-invoice approval flow recovers 4.2% of gross margin outright, simply by removing the window where emotional write-downs happen. Approve at entry against the contract, not at month-end against a feeling.
Do this Monday: pull last month's delivered hours by project, pull invoiced hours by project, and compute the spread per engagement. Rank by dollar leakage. The two or three engagements at the top are where your enterprise value is hemorrhaging, and they're where this work pays for itself first. For the full mechanics of resetting these numbers, see The Utilization Rate Calculator That Stops Profit Leakage.