
The practical answer
- Short answer
- Stop optimizing for GMV. Here are the 2025 B2B marketplace benchmarks for Take Rate, Net GMV Retention, and LTV:CAC that investors actually vet.
- Best fit
- Industry: B2B Tech / Services. Function: Finance & Operations
- Operating path
- Unit Economics → Commercial Performance → Transaction Advisory Services
- Key metric
- 25% Target Take Rate for high-value B2B service marketplaces (vs. 1-3% for commodities).
The GMV Vanity Trap: Why You're Failing Fundraising
I recently reviewed a Series B deck for a B2B marketplace connecting industrial suppliers with manufacturers. The headline number was impressive: $120M Gross Merchandise Value (GMV). The founder was beaming. She had doubled GMV year-over-year.
Then I turned the page to the P&L. Net Revenue was $4.8M. Gross Margin was 30%. Burn was $8M.
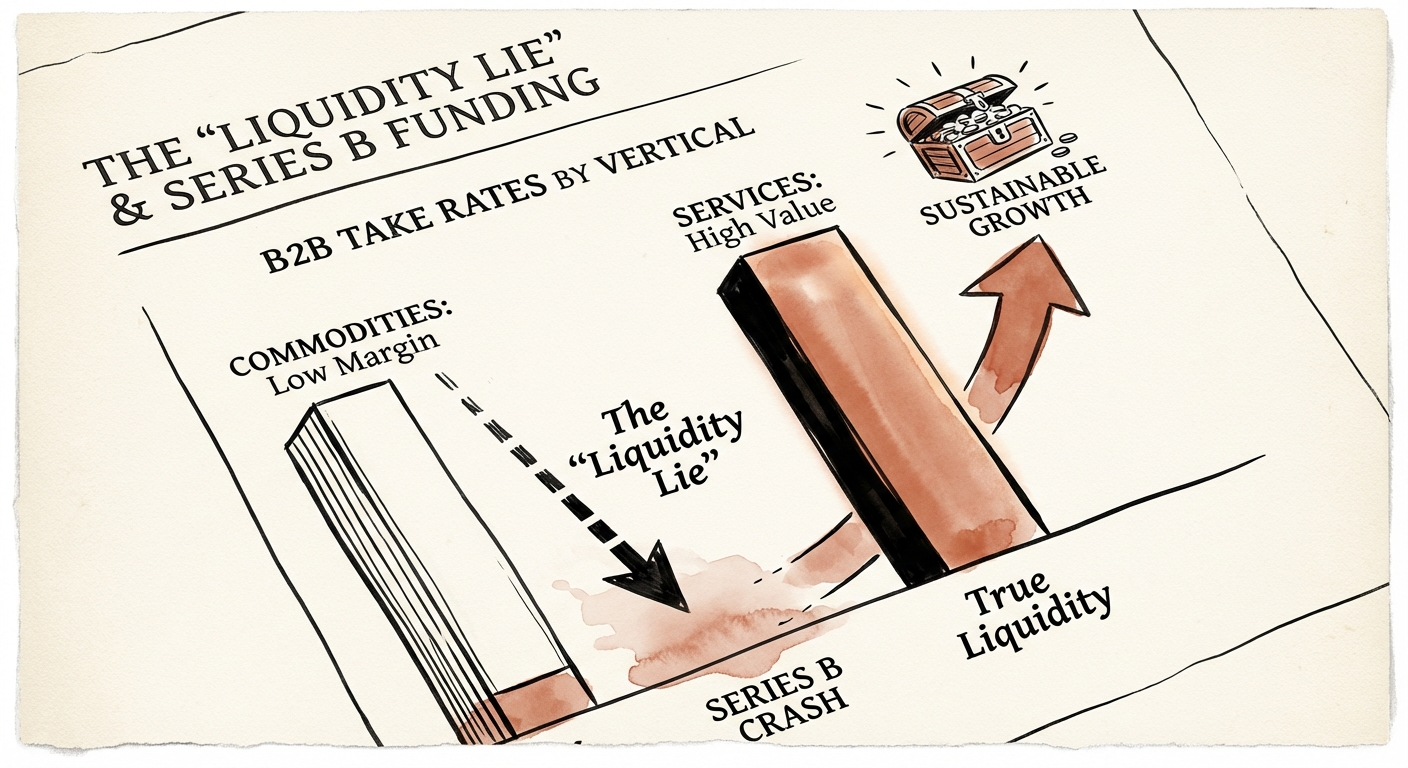
The company didn't have a growth business; it had a very expensive clearinghouse. This is the Liquidity Lie. In B2B, GMV is a vanity metric. Unlike B2C marketplaces (Uber, Airbnb) where high frequency and standardized inventory drive a clear 15-25% take rate, B2B marketplaces often struggle with "lumpy" transactions, complex workflows, and massive disintermediation risk.
Investors in 2025 have stopped funding GMV. They fund Net Revenue Retention (NRR) and Unit Economics. If you are facilitating $100M in transactions but only keeping $3M while spending $5M to acquire that volume, you aren't a platform—you're a subsidized middleman.
The Difference Between "Flow" and "Stickiness"
The diagnostic test I use for every marketplace founder is simple: Are you a destination or a directory?
- Directory (Bad): Buyers use you to find a supplier, then transact offline to save the fee. Your GMV Retention flatlines after Month 3.
- Destination (Good): You handle payments, compliance, financing, or logistics. The friction of leaving is higher than the take rate. Your GMV Retention expands over time.
In B2B, GMV is vanity. Net Revenue Retention is sanity. If your cohorts aren't spending more in Year 2 than Year 1, you don't have a marketplace—you have a leaky lead-gen agency.
The 2025 Benchmarks: Where Do You Stand?
Stop guessing. Based on data from Battery Ventures, Point Nine, and our own firm's due diligence across 40+ marketplace deals, here are the numbers you need to hit to survive scrutiny.
1. The "True" Take Rate
Founders often target a flat 10-15% take rate because they saw it in a generic VC blog post. In B2B, take rates are highly vertical-specific. If you charge too much in a low-margin industry (like commodities), you invite disintermediation. If you charge too little in high-value services, you leave margin on the table.
| Marketplace Type | Avg. Transaction Size | Target Take Rate |
|---|---|---|
| Raw Materials / Commodities | $50k - $1M+ | 1% - 3% |
| Wholesale Goods (Faire model) | $500 - $5k | 10% - 15% |
| B2B Services / Labor | $2k - $20k | 15% - 25% |
2. Net GMV Retention (The Holy Grail)
Forget user retention. In B2B, you can lose 20% of your small buyers and still be healthy if your large buyers spend 3x more. This is Net GMV Retention.
- Warning Zone: < 80% at Month 12 (You are a leaky bucket).
- Good: 100% - 120% (You are retaining wallet share).
- Elite (Series B+ Ready): > 140% (Your cohorts are growing; you have negative churn).
3. Buyer-to-Supplier Liquidity Ratio
How many suppliers does a buyer need to see to make a purchase? If your ratio is 1:1, you aren't a marketplace; you're a broker. Healthy B2B marketplaces typically see a ratio where top 20% of suppliers serve 80% of demand, but new suppliers can still break in (the "cold start" problem).
Fixing the Unit Economics: The "Rake" vs. The Value
If your benchmarks are flashing red, you don't need more marketing. You need Revenue Architecture surgery.
1. Monetize the Fintech Layer
If your take rate is stuck at 3% because suppliers refuse to pay more, stop raising fees on the transaction. Instead, monetize the capital. B2B buyers often need Net-30 or Net-60 terms. Suppliers want paid Net-0. The hidden margin is in bridging that gap. Factoring fees or "Buy Now Pay Later" for B2B can add 1-3% to your effective take rate without angering the supply side.
2. Attack Concentration Risk
A common B2B killer is "Whale Concentration." If your top 5 sellers account for 50% of your GMV, they hold the power. They will eventually demand lower fees or leave. You must actively cap exposure to any single supplier or build "lock-in" features (like proprietary inventory management software) that make leaving painful. This is the difference between valuation drivers and risk factors.
3. Enforce the "Platform Tax" via Compliance
Why do companies stay on a marketplace charging 15%? Because of compliance. If you automate tax collection, insurance verification (COIs), and cross-border customs documentation, the cost of leaving becomes higher than the fee. Shift your value proposition from "finding suppliers" (which is a one-time value) to "managing risk" (which is an ongoing value).
Your unit economics aren't just numbers on a spreadsheet; they are the verdict on your product's utility. Fix the leak before you pour in more capital.