The practical answer
- Short answer
- Founders walk into a sale with a 5:1 LTV/CAC and walk out at 1.8:1. The three formula choices that inflate it, and how to rebuild the number before a buyer does.
- Best fit
- Industry: B2B Software. Function: Finance & Operations
- Operating path
- Unit Economics → Commercial Performance → Transaction Advisory Services
- Key metric
- 34% Understatement of true CAC when excluding onboarding and pre-sales engineering expenses.
The number that looked like a strength became the reason the deal stalled
A founder-CEO I worked with ran a $40M ARR software platform into a sale process carrying a 5.2:1 LTV/CAC ratio on the lead slide. He believed it, his board believed it, and the banker had penciled the metric into a 12x revenue story. Three days into the data room, the rebuilt ratio sat at 1.8:1. Nobody on the buy side accused him of lying. They simply recalculated the same inputs the way an acquirer always does, and the gap between his number and theirs became the negotiation.
This is the quiet violence of LTV/CAC: it is not one metric, it is a chain of three choices, and each choice can be made to flatter you. Most operators make all three flattering choices without noticing, because the formula was built to justify last year's spend rather than to predict the next dollar's return. The pattern is common enough that diligence teams price it in before they open your model. PitchBook's Q1 2026 Enterprise Valuation Multiples shows buyers now routinely discount self-reported unit economics by 55% as a starting posture. You are not negotiating up from your number. You are negotiating up from a number a stranger built to be skeptical.
Trap one: you put revenue in the numerator, they put gross profit
Lifetime value should be the gross profit a customer generates over their life, not the invoices they pay. A customer at $100K a year for five years is not $500K of LTV if it costs $40K a year to host, support, and keep their instance alive. That is $300K of gross profit, and the difference is not a rounding error. Gartner's 2026 B2B SaaS Margin Benchmark puts the average inflation from skipping gross margin at 28% across the mid-market.
The fix is one multiplication most teams omit. When you calculate customer lifetime value, multiply ARPU by gross margin before you divide by churn. At a 72% gross margin, that single step shaves 28 cents off every dollar of LTV you were carrying. Run it on your own model this week. If your LTV slide uses revenue, you are already a quarter overstated before anyone touches your CAC, and the customers you celebrated acquiring may never throw off enough cash to fund the next batch.
A buyer doesn't argue with your LTV/CAC slide. They rebuild it in a spreadsheet you never see, using gross profit, fully burdened CAC, and the churn of the cohort you signed last quarter. Then they reprice you against that number, not yours.
Trap two: the costs you parked outside the denominator
The Series B reflex is to divide marketing spend plus sales commission by new logos and call it CAC. That arithmetic is a decision about what to leave out, and what gets left out is almost always the expensive part. The honest test is brutal and simple: if a cost exists only to win or activate a customer, it lives in the denominator. Apply that test and watch the line items reappear.
The salaries of the sales engineers who run every technical evaluation. The marketing tech stack. The travel for enterprise field teams. The non-billable implementation hours it takes to get an account to go-live. These do not disappear into G&A or R&D because they belong there; they get parked there because it protects the ratio. Bain's 2025 Customer Acquisition Cost Analysis found that excluding onboarding and sales engineering alone understates true CAC by 34%. That is more than a third of your acquisition cost hiding one tab over in the chart of accounts.
The overhead you swear is fixed isn't fixed
The defense for leaving out agency retainers, PR firms, and the fully loaded comp of the VP Sales and CMO is that they are fixed overhead. Run the counterfactual: shut down the go-to-market org tomorrow and those salaries and retainers vanish right alongside new-logo acquisition. A cost that evaporates when you stop selling is an acquisition cost, which is the whole point of calculating true CAC payback with the hidden costs included.
Understated CAC does more than flatter a slide; it misallocates your next round. You read a 12-month payback, greenlight more spend, and the real payback was 22 months of burn before break-even. A buyer's quality-of-earnings team sweeps every go-to-market dollar into the denominator in week one and your headline ratio halves on contact. You do not want to discover that across a conference table. Do the sweep yourself first: pull every marketing license, enablement tool, and pre-sales technical resource into the acquisition math, and find out what your real number is while you still control the narrative around it.
Trap three: the customer lifespan you can't possibly have observed
The third choice hides in the denominator of LTV: lifespan, calculated as 1 divided by churn. Churn 10% of logos a year and the formula hands you a ten-year customer life. If your company is four years old, you are claiming six years of retention you have never once observed. It is a forecast dressed as a fact, and it is the single largest source of LTV inflation because it compounds against the other two.
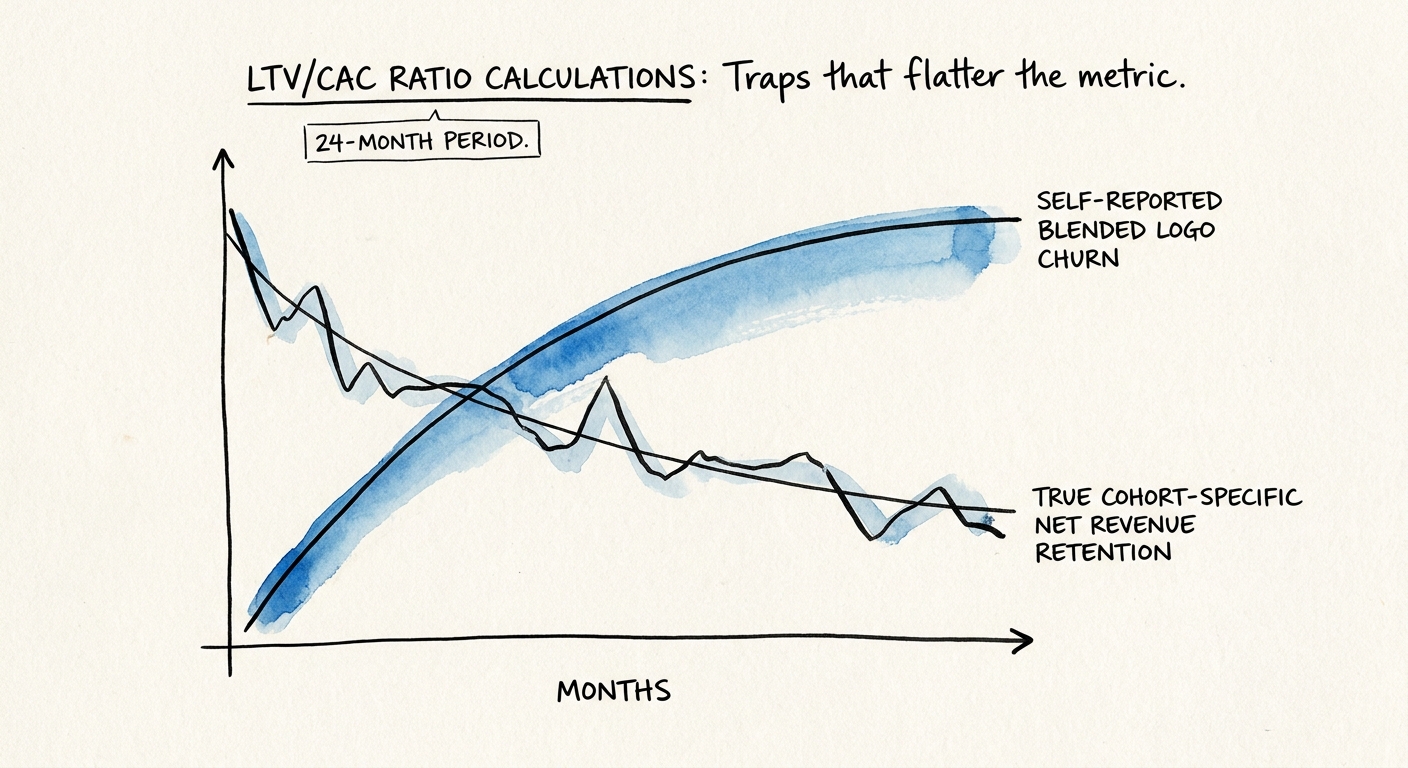
Blending churn rates is how the fiction holds together. Your oldest enterprise accounts churn at 3%; the mid-market logos you signed in the last twelve months are bleeding out at 25%. Blend them and you report a tidy 12%, which describes a customer base you no longer sell to. The cohort you are acquiring today churns nothing like your average. McKinsey's 2026 SaaS Unit Economics Report measured the gap: blended logo churn overestimates customer lifespan by 42% versus cohort-specific data.
And the churn that doesn't show up as churn at all
Even cohort logic misses downgrade churn, which never trips the retention metric. An account that drops from a $150K enterprise tier to a $30K essential tier still counts as a retained logo, while the model quietly loses 80% of that account's expected value. BCG's 2026 Recurring Revenue Dynamics puts the additional lifetime-revenue inflation from ignoring downgrades at 19%. Logo retention says everything is fine; the bank account disagrees.
What to do Monday: abandon blended logo churn entirely. Rebuild lifespan on net revenue retention applied to specific annual cohorts, and run the CAC payback diagnostic against each cohort separately. If the 2024 cohort is contracting, that contraction rate sets the LTV of your 2024 acquisition engine, not the flattering blend. Stack all three corrections together, gross profit in the numerator, fully burdened CAC in the denominator, cohort-level net revenue churn for lifespan, and the 5:1 you walked in with often lands near 1.5:1. It is an ugly number. It is also the only one a buyer will pay against, and the only one that tells you where to actually fix the business before you sell it.