The practical answer
- Short answer
- Stop using the 'MBA formula' for LTV. It hides churn, ignores expansion, and kills Series B startups. Here is the operator's guide to calculating true B2B SaaS LTV.
- Best fit
- Industry: B2B SaaS. Function: Finance & Revenue Operations
- Operating path
- Unit Economics → Commercial Performance → Transaction Advisory Services
- Key metric
- 15 Months (Median CAC Payback for Healthy B2B SaaS)
The "MBA Formula" Is Killing Your Runway
If you are presenting an LTV:CAC ratio of 5:1 to your board but struggling to make payroll, you are likely the victim of the "Simple LTV" lie. The standard formula taught in business schools—Average Revenue Per User (ARPU) divided by Churn Rate—is mathematically clean, theoretically sound, and operationally dangerous for a Series B company.
This formula assumes three things that are almost never true in scaling B2B SaaS:
- Linear Churn: It assumes a customer is as likely to churn in Month 36 as in Month 3. In reality, 40% of churn often happens in the first 90 days (implementation failure).
- Zero Expansion: It ignores Net Revenue Retention (NRR). If your NRR is 110%, the simple formula breaks or underestimates your compounding growth.
- 100% Gross Margin: Most founders calculate LTV based on Revenue, not Gross Profit. They treat every dollar of ARR as if it drops straight to the bottom line, conveniently forgetting that Customer Success, hosting, and DevOps costs scale with revenue.
The result? You overestimate your customer value by 30-50%, leading you to overspend on acquisition. You think you’re buying $5 bills for $1. In reality, you’re buying $3 bills for $1, but they take 24 months to print. That is not a growth engine; that is a liquidity crisis.
You can't pay payroll with 'Lifetime Value.' You pay it with cash. If your LTV model says you're rich but your bank account says you're poor, trust the bank account.
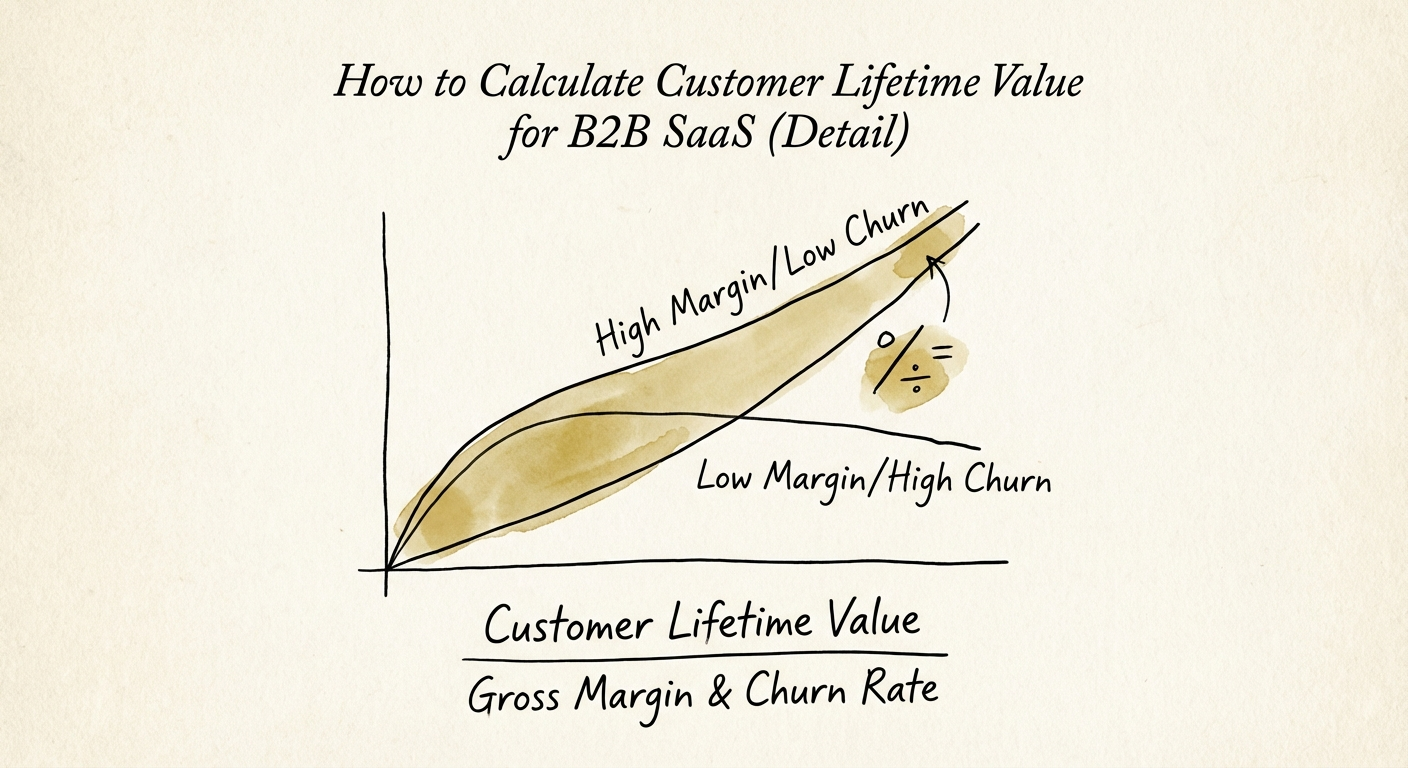
The Operator’s LTV Calculation
To calculate an LTV that you can actually bank on, you need to strip away the vanity metrics. We use a three-step adjustment process to find True Net LTV.
Step 1: Calculate True Gross Margin
Stop looking at your accounting software’s default "Gross Profit." For SaaS LTV, you must deduct the true Cost of Goods Sold (COGS). This includes:
- Hosting & Infrastructure: AWS/Azure/GCP bills (the portion dedicated to production).
- Customer Success (Support): The salaries of the people who answer tickets and fix bugs. This is maintenance, not sales.
- Implementation Costs: If you lose money on onboarding, that debt comes out of LTV.
- Third-Party Data/API Fees: Any per-seat or usage-based costs you pay to vendors like Twilio or OpenAI.
Benchmark: Top-tier B2B SaaS companies aim for 80% Gross Margin. If you are heavy on services or "human-in-the-loop" delivery, you might be closer to 60%. If you calculate LTV using Revenue instead of Gross Profit at 60% margins, you are overstating your LTV by 66%.
Step 2: The Finite Expansion Formula
If your Net Revenue Retention (NRR) is >100%, standard churn formulas return a negative denominator, implying "Infinite LTV." While mathematically interesting, you cannot take "Infinite" to the bank. Investors and acquirers cap LTV horizons—usually at 5 years (60 months) for Enterprise and 3 years (36 months) for SMB.
Use this formula for a realistic view:
LTV = (Annual Gross Profit per Account × Lifetime Cap in Years) × (Net Revenue Retention Rate ^ (Years / 2))
This is a conservative heuristic. It acknowledges that expansion happens, but it applies a decay factor. It prevents the "Infinite LTV" hallucination while rewarding you for strong NRR.
The "Death Zone": LTV vs. Payback Period
Here is the hard truth for founders: LTV is a vanity metric; CAC Payback is a survival metric.
You can have a beautiful LTV:CAC ratio of 6:1. But if your CAC Payback Period is 24 months, you will run out of cash before you realize that value. In the current interest rate environment, capital is expensive. Efficiency trumps potential.
2025 Benchmarks for B2B SaaS
- SMB SaaS (ACV <$20k): Target Payback: <12 Months. LTV:CAC: 3:1.
- Mid-Market (ACV $20k-$100k): Target Payback: 12-15 Months. LTV:CAC: 4:1.
- Enterprise (ACV >$100k): Target Payback: 15-18 Months. LTV:CAC: >5:1.
If your payback period exceeds 18 months, you are in the "Death Zone." You are financing your customers' growth with your equity. To fix this, you don't just need "better marketing." You need to look at Gross Margin Expansion (raising prices or lowering support costs) and Sales Velocity. A lower LTV collected faster is often worth more than a higher LTV collected slower.