
The practical answer
- Short answer
- Learn how to calculate SaaS sales efficiency using the Magic Number, gross-margin adjustments, fully loaded Sales and Marketing spend, and sales-cycle lag.
- Best fit
- Industry: B2B SaaS. Function: Revenue Operations & Finance
- Operating path
- Unit Economics → Commercial Performance → Transaction Advisory Services
- Key metric
- 0.75 A common threshold for considering whether sales efficiency supports continued scaling.
Why the Standard Magic Number Can Mislead
Founders often overstate sales efficiency because they calculate the numerator using booked ARR without adjusting for gross margin, one-time services, implementation burden, or the actual lag between sales spend and closed revenue. The standard Magic Number formula is useful, but it is only a starting point.
Most SaaS operators compute sales efficiency by taking current-quarter net new ARR and dividing it by prior-quarter Sales and Marketing spend. That can work for a simple business with a short sales cycle and clean recurring revenue. It breaks down when enterprise deals take 150 to 180 days, implementation services carry lower margin, or a meaningful part of revenue is not recurring.
To evaluate the real go-to-market engine, calculate both the gross Magic Number and a gross-margin-adjusted version. If your gross margin is 75%, every dollar of new ARR only contributes 75 cents before recovering acquisition cost. Ignoring that reality can lead to premature sales hiring and weak cash planning.
A sales efficiency ratio is only board-grade when it includes gross margin, fully loaded acquisition cost, and the actual sales-cycle lag.
The Denominator Deficit and Sales Cycle Lag
The denominator should be fully loaded. That means including quota-carrying sales payroll, sales engineering, SDR costs, revenue operations tooling, management overrides, recruiting costs for sales hires, travel, and directly attributable demand-generation spend. If these costs are omitted, the metric encourages the company to scale a motion that is more expensive than it looks.
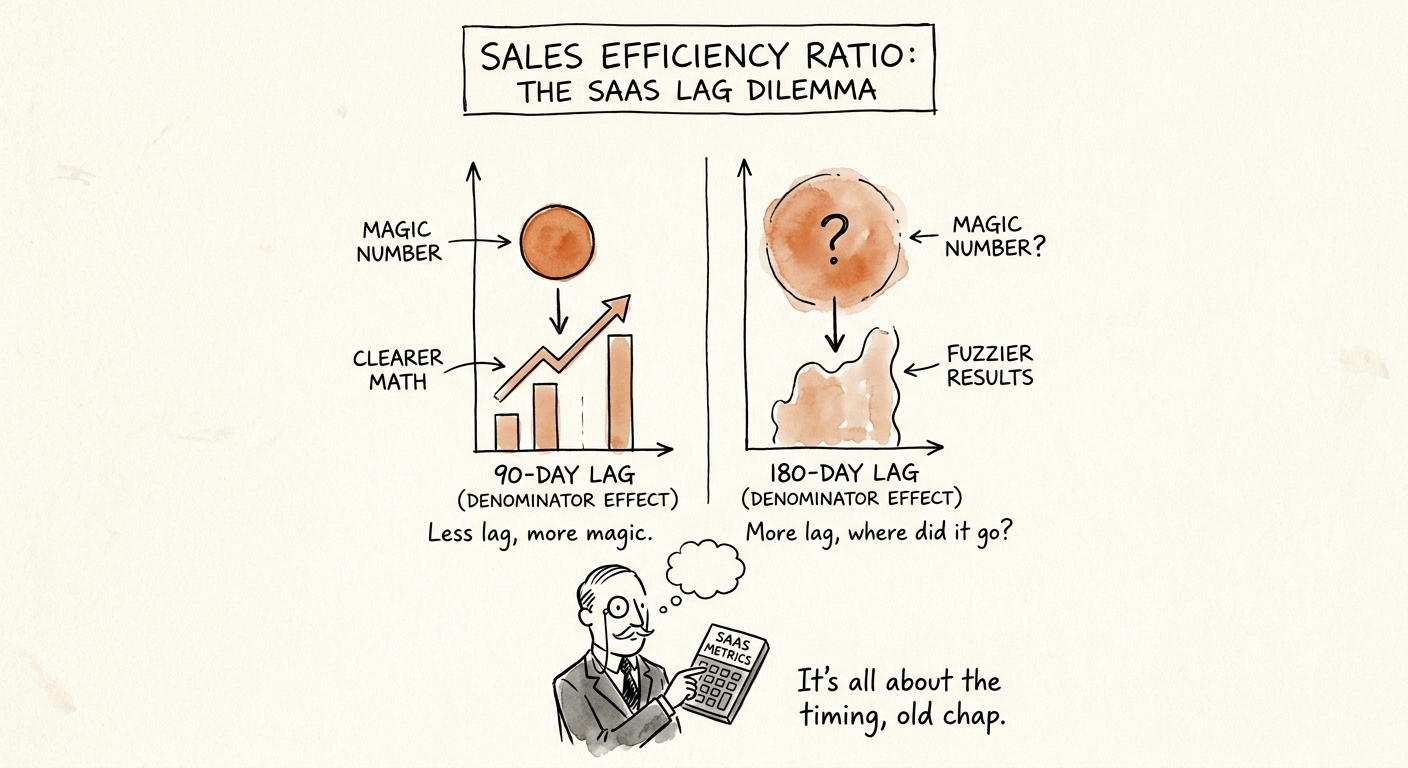
The numerator and denominator also need to respect sales-cycle lag. If you sell $150,000 ACV enterprise software, comparing Q3 revenue to Q2 Sales and Marketing spend may be too short. Use your CRM history to determine whether a one-quarter, two-quarter, or weighted lag better reflects reality.
If you want to survive institutional due diligence, understand how to calculate the SaaS magic number with enough precision that buyers cannot easily recast the metric into a worse story. They will load hidden costs, adjust timing, and separate recurring ARR from lower-quality revenue.
The Board-Grade Formula: Net Magic Number
A more useful sales efficiency metric is the gross-margin-adjusted Magic Number: (Current Period Net New ARR x Gross Margin %) / (Sales-Cycle-Adjusted Prior Sales and Marketing Spend). This tells you how efficiently the business turns acquisition spend into gross profit, not just booked ARR.
A number above 0.75 can support continued scaling when retention and payback are healthy. A number between 0.5 and 0.75 usually calls for optimization of pricing, channel mix, segmentation, or sales productivity. A number below 0.5 should trigger a serious review before adding more quota capacity.
Do not rely on a blended ratio. Segment sales efficiency by channel, geography, product line, and customer size. A strong self-serve motion can hide an inefficient enterprise motion, and the wrong hiring decision can follow. Evaluate sales efficiency alongside the SaaS Quick Ratio and CAC payback benchmarks so the board sees the cash reality of your unit economics.