The practical answer
- Short answer
- Two SaaS companies grow ARR 40% a year. One raises at a premium, one stalls. The Quick Ratio is why. Here is the formula, the 4.0 bar, and the fix.
- Best fit
- Industry: B2B SaaS. Function: Finance
- Operating path
- Unit Economics → Commercial Performance → Transaction Advisory Services
- Key metric
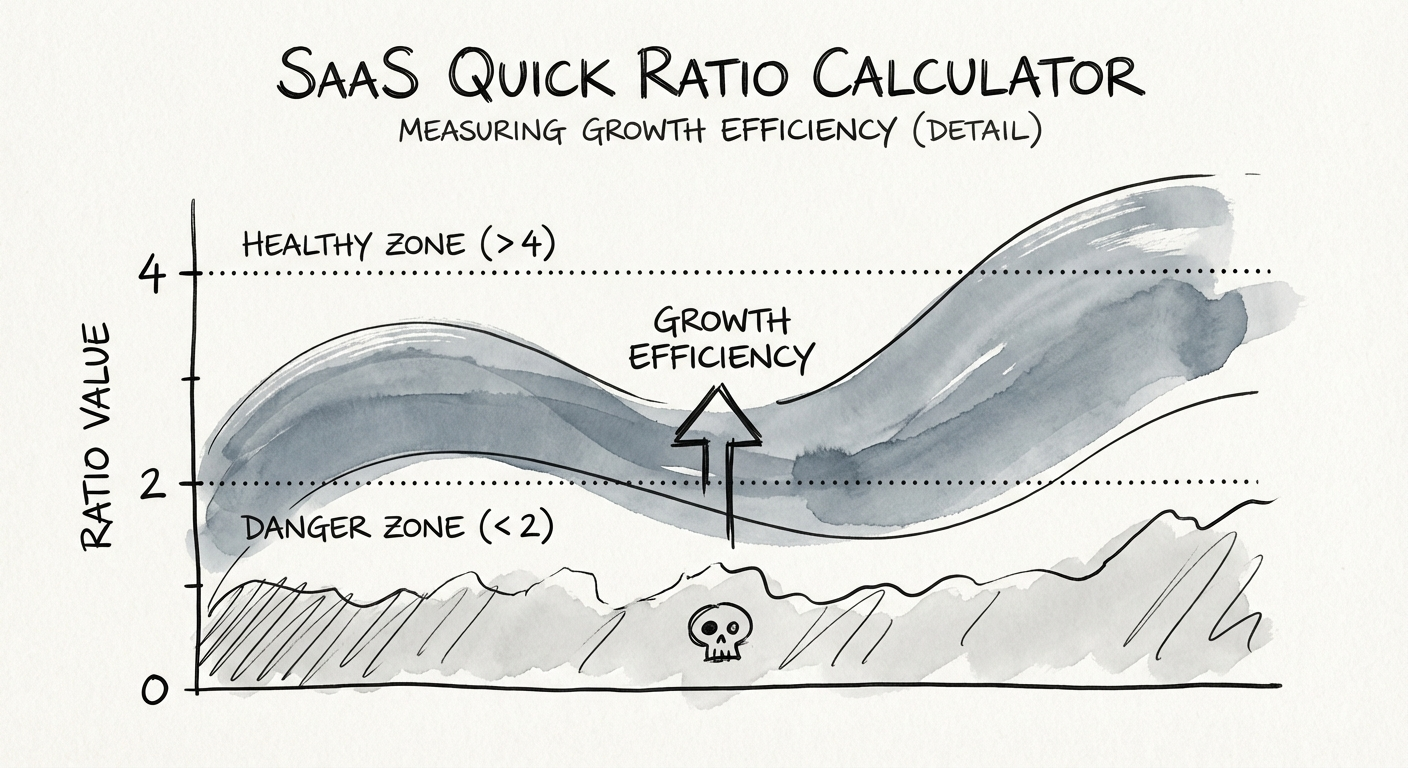
- 4.0 The 'Gold Standard' Quick Ratio for investable Series B SaaS companies.
Two companies, same growth rate, opposite outcomes
Picture two B2B SaaS businesses sitting across from the same growth-equity partner. Both did $24M ARR last year. Both grew 40%. On the headline slide, they are twins.
Company A added $11M in new and expansion revenue and lost $1.4M to churn and downgrades. Company B added $20M and lost $10M. Same net growth, wildly different machines. Company A is compounding; Company B is bailing water with a bucket that has a hole in the bottom. The partner funds A at a premium and passes on B with a polite note about "efficiency." Neither founder said the word "churn" in the meeting. They didn't have to. The Quick Ratio said it for them.
That ratio is the cleanest single read on whether a $10M-to-$50M SaaS business is actually building durable revenue or just renting growth from the sales team. Company A's Quick Ratio is 7.9. Company B's is 2.0. Mamoon Hamid, who popularized the metric, put the failure mode bluntly: a ratio that low means you're running flat out just to stay in the same place (SaaStr).
Here is why this matters at Series B specifically. In the seed-to-Series-A phase, you can out-hustle a leaky bucket. Lose a logo, the founder closes two more by Friday. At $24M ARR with a 9-figure target on the cap table, the founder can't personally backfill churn anymore, and the leakage compounds against you every single month. The Quick Ratio is the first metric that catches up with you when the heroics stop scaling.
When a Quick Ratio sits below 2.0, I don't ask the founder about their sales pipeline. I ask them which customers they're about to lose, because the diligence team already knows.
The formula, and the part everyone fudges
The math is a ratio of revenue in to revenue out, measured on the same monthly recurring basis:
SaaS Quick Ratio = (New MRR + Expansion MRR) / (Churned MRR + Contraction MRR)
Inflow is new-logo MRR plus expansion MRR (upsells, seat growth, usage tiers). Outflow is fully churned MRR plus contraction MRR (downgrades and partial cancellations). The trap is in the denominator. Most founders track gross logo churn and quietly omit contraction, because a customer who shrank from $4K to $1.5K per month "didn't churn." They lost $2.5K of recurring revenue, and your Quick Ratio is supposed to feel it. If your number looks suspiciously healthy, check whether contraction is even in your billing data — ChartMogul walks through how the MRR movement components have to net out before the ratio means anything.
Where the line actually sits
Run the trailing twelve months, then run last quarter, and compare. The bands that matter for a scaling company:
- Below 2.0 — stop hiring reps. For every $2 you add, $1 walks out. This is a denominator emergency, not a pipeline shortage. Pouring more leads in just burns cash faster and accelerates the leak. Adding headcount here is the most common mistake I see, and it's the one that turns a survivable problem into a down round.
- 2.0 to 4.0 — fine for a mature company, a yellow flag at Series B. You're growing, but the friction is taxing every dollar. There is almost always a net revenue retention problem hiding underneath. Buyers and investors will discount you because they can see the drag.
- Above 4.0 — the bar for a premium round. Every $1 lost is replaced by $4 of stable new and expansion revenue. That math only holds when the base defends itself, which is why a 4.0+ signals real product-market fit rather than a heroic sales quarter. Lineal CPA's 2025 read reflects how much stricter capital markets have gotten about this since the zero-rate era ended.
One nuance the bands hide: the ratio rewards small companies and punishes large ones. A $5M business that adds $400K and loses $40K posts a gorgeous 10.0. The same machine at $40M ARR mathematically can't, because the base it has to defend is eight times larger. Don't celebrate a high number without checking it against your stage — and don't panic at a 4.0 if you're closing on $50M ARR. The trend line quarter over quarter tells you more than the absolute number ever will.
You got a 2.5. Now diagnose which half is broken.
The reason the Quick Ratio is useful and not just judgmental is that it splits cleanly into two problems. A 2.5 is either a fat denominator or a thin numerator, and the fix for each is the opposite of the fix for the other.
If the denominator is the problem (you're losing too much)
Decompose your churn before you touch anything else. Pull your last twelve months of churned and contracted accounts into one list and look for the pattern. The most common finding at this stage: one customer segment is doing most of the damage. Say a 40-person SaaS company built for mid-market keeps signing scrappy 5-seat startups because they're easy closes — and then those startups die or downgrade at triple the rate of the core base. That segment is dragging the whole ratio down while feeling like "growth." Tightening the qualification rule at the top of funnel fixes the ratio faster than any retention program. The second-most-common finding is a first-90-days problem: accounts that never reached real usage were gone before anyone called them. A deliberate churn prevention motion aimed at the early lifecycle moves the denominator more than a heroic save desk ever will.
If the numerator is the problem (your growth is too logo-dependent)
Low churn but a ratio still under 4.0 means expansion is missing. You're funding growth almost entirely by hunting new logos, which is the expensive way to move the number. Two levers: first, packaging — a single flat price caps expansion MRR by design, so a usage or seat-based tier that lets good customers spend more without a renegotiation is often the single highest-leverage change. Second, comp — if Customer Success is paid only on retention, no one in the building owns the cheapest revenue you have. None of this saves you if the underlying sales motion is inefficient, so pressure-test the cost of that new-logo growth in parallel.
What to do Monday
Calculate the ratio twice — trailing twelve months and last quarter — and put both numbers in front of your board next to the ARR slide. Then decompose the denominator into churn versus contraction and the numerator into new versus expansion, so you know which of the four levers you're actually pulling. If the quarterly number is below the TTM number, your machine is getting worse, not better; freeze sales hiring and fix the bucket before you fund the faucet. A $20M business at a 5.0 outvalues a $30M business at 1.5 in every diligence room I've sat in — because one is compounding and the other is sprinting in place.