
The practical answer
- Short answer
- Most founders calculate CAC Payback wrong. Learn the 'True Payback' formula that factors in Gross Margin, onboarding costs, and churn to stop burning cash.
- Best fit
- Industry: B2B SaaS. Function: Finance
- Operating path
- Unit Economics → Commercial Performance → Transaction Advisory Services
- Key metric
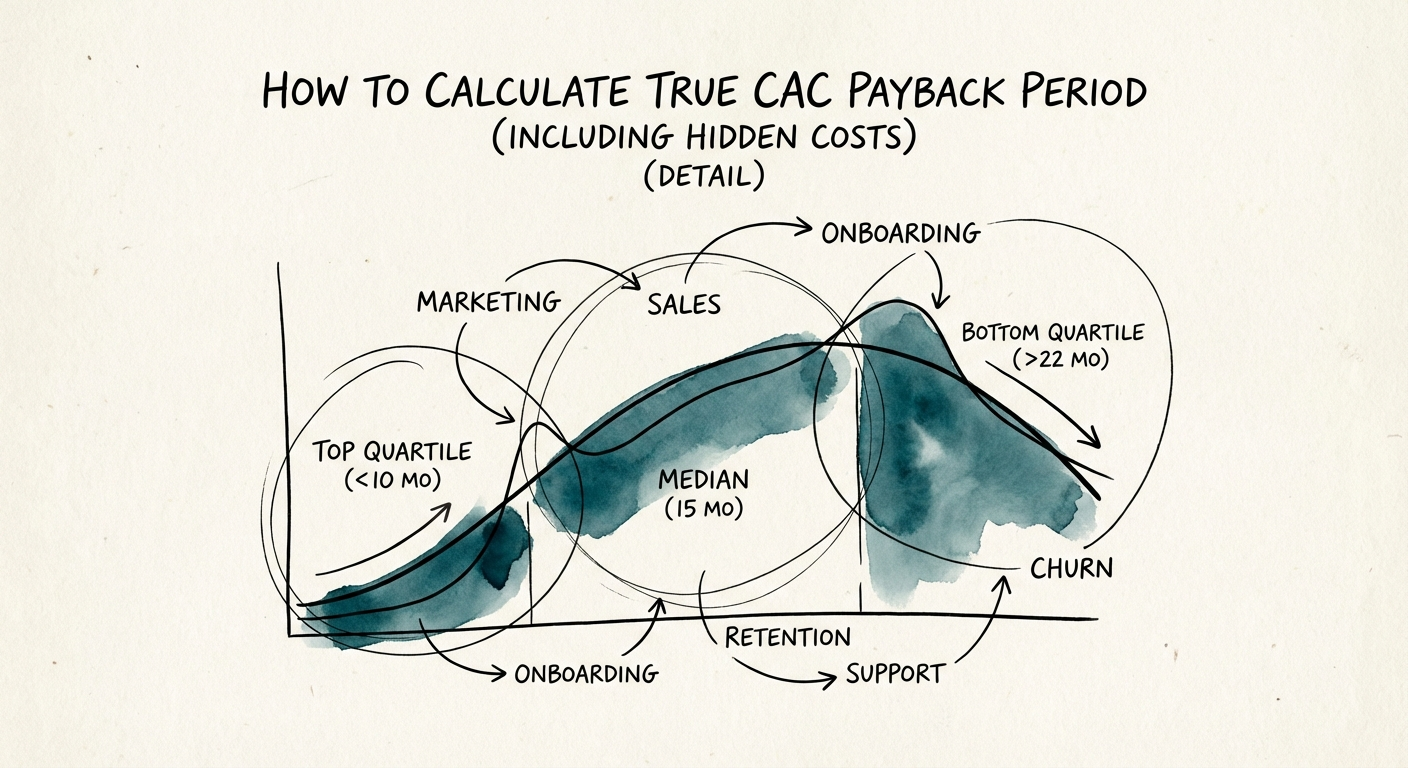
- 15 Months Median CAC Payback for Series B SaaS (2025)
The Vanity Metric That Kills Cash Flow
If you ask most Series B founders what their CAC Payback Period is, they will confidently say "9 months." They say this because they took their total Sales & Marketing spend, divided it by New ARR, and called it a day. This is the "Venture Vanity" formula. It is useful for pitch decks, but it is dangerous for operating.
The problem with the standard calculation (CAC / New ARR) is that it assumes your revenue is 100% profit. It assumes that every dollar a new customer pays goes directly to paying back the cost of acquiring them. In the real world, this never happens.
If your Gross Margin is 70%—which is standard for B2B SaaS—you only keep 70 cents of every dollar. That means a "9-month" payback is actually nearly 13 months. If your margins are closer to 50% (common in tech-enabled services), your 9-month payback is actually 18 months. This delta explains why companies with "efficient" metrics still burn cash faster than they can grow: they are calculating payback on revenue, not on the profit available to pay back the debt.
For tech-enabled services or heavy implementation SaaS, ignoring Gross Margin in your CAC calculation isn't just an accounting error; it's a solvency risk.
Your bank account knows the truth about your payback period, even if your board deck doesn't. Stop calculating payback on Revenue and start calculating it on Gross Profit.
The Three Hidden Costs You Aren't Counting
Beyond the Gross Margin error, most founders miss three specific "shadow costs" that artificially deflate their CAC Payback figures.
1. The Unbilled Implementation Trap
If you charge $5,000 for implementation but it costs you $15,000 in engineering hours to set up, that $10,000 delta is CAC. Most finance teams bury this in COGS (Cost of Goods Sold) or R&D. But if that spend is required to unlock the revenue, it is part of the acquisition cost. Ignoring this makes your payback look months shorter than reality.
2. The "Customer Success" Sales Rep
Who handles the first 90 days of the customer journey? If your CSMs (Customer Success Managers) are spending 40% of their time on onboarding and adoption to prevent early churn, that portion of their salary is not COGS—it is CAC. You are still "winning" the customer. Benchmarking your CAC without loading these salaries leads to a false sense of efficiency.
3. The Churn-During-Payback Drag
The standard formula assumes the customer stays forever. But if your True Payback is 18 months, and your average customer churns at month 14, you mathematically never break even. You are paying to lose money. This is why net retention and payback must be viewed together; high churn invalidates even a short payback period.
The 'True Payback' Formula & Diagnostic
To operate with reality, you need to switch from the Vanity Formula to the Operator Formula. This is the number you should use for internal budgeting and cash flow forecasting.
The Formula
True CAC Payback = Total S&M + Onboarding Deficit / (New ARR × Gross Margin %)
Let’s look at the impact. A company with $10M New ARR and $10M S&M spend looks like it has a 12-month payback (1.0x). But apply a 70% Gross Margin and factor in $1M of unbilled implementation costs:
($10M S&M + $1M Onboarding) / ($10M ARR × 0.70) = $11M / $7M = 1.57 Years (19 Months)
The difference between 12 months and 19 months is the difference between a growth round and a down round. If your True Payback is creeping above 18 months, you are in the "Danger Zone" for a Series B company. You must either improve gross margins (raise prices, reduce hosting costs) or drastically cut the friction in your onboarding process.