
The practical answer
- Short answer
- A 4.0 SaaS Quick Ratio can still hide expensive growth. Learn how to separate expansion ARR, new-logo ARR, contraction, churn, and CAC payback.
- Best fit
- Industry: B2B SaaS. Function: Finance & RevOps
- Operating path
- Unit Economics → Commercial Performance → Transaction Advisory Services
- Key metric
- 4.0 Traditional quick-ratio benchmark that still needs efficiency context.
The Denominator Disconnect
A 4.0 SaaS Quick Ratio can look healthy while still masking an expensive growth engine. The traditional formula treats every dollar of new ARR the same, whether it comes from low-CAC expansion or from a heavily discounted new logo with a long payback period. That is why buyers and boards increasingly ask what is inside the numerator, not just whether the blended ratio clears a simple threshold.
The old rule of thumb was that generating four dollars of new revenue for every dollar lost signaled strong growth. That still matters, but it is incomplete. If a company is outrunning gross churn with expensive outbound acquisition, the quick ratio can create false confidence. The business may be growing while consuming too much cash for each net new dollar.
The due diligence process now dissects the composition of ARR growth. Expansion ARR, new-logo ARR, contraction, and churn should be shown separately, with CAC payback and gross retention by cohort. If you are masking product-market fit drift with marketing spend, the analysis will surface during buyer diligence. Start by evaluating your SaaS Quick Ratio growth efficiency with those components separated.
A Quick Ratio of 4.0 means much less if the numerator depends on expensive new-logo ARR and the denominator is hiding weak retention.
The Net-New Efficiency Tax
The core problem with many executive dashboards is that they do not connect Quick Ratio to customer acquisition cost. Adding $100,000 in net new ARR looks good on the surface. If the sales and marketing cost to acquire that cohort is too high, and gross retention is weak, the company is renting revenue rather than building durable value.
That is why the Quick Ratio should sit next to CAC payback, gross retention, expansion rate, and the SaaS Magic Number. A high ratio powered by low-CAC expansion revenue is very different from a high ratio powered by expensive new-logo acquisition. The former improves margin quality. The latter can drain cash even while headline ARR rises.
The strongest companies show the source of growth clearly. They identify whether ARR growth came from expansion, cross-sell, price increases, new logos, or reactivation. That mix tells buyers whether growth is repeatable and profitable or whether it depends on an expensive sales motion that may not scale.
Fixing the Denominator and Scaling Truth
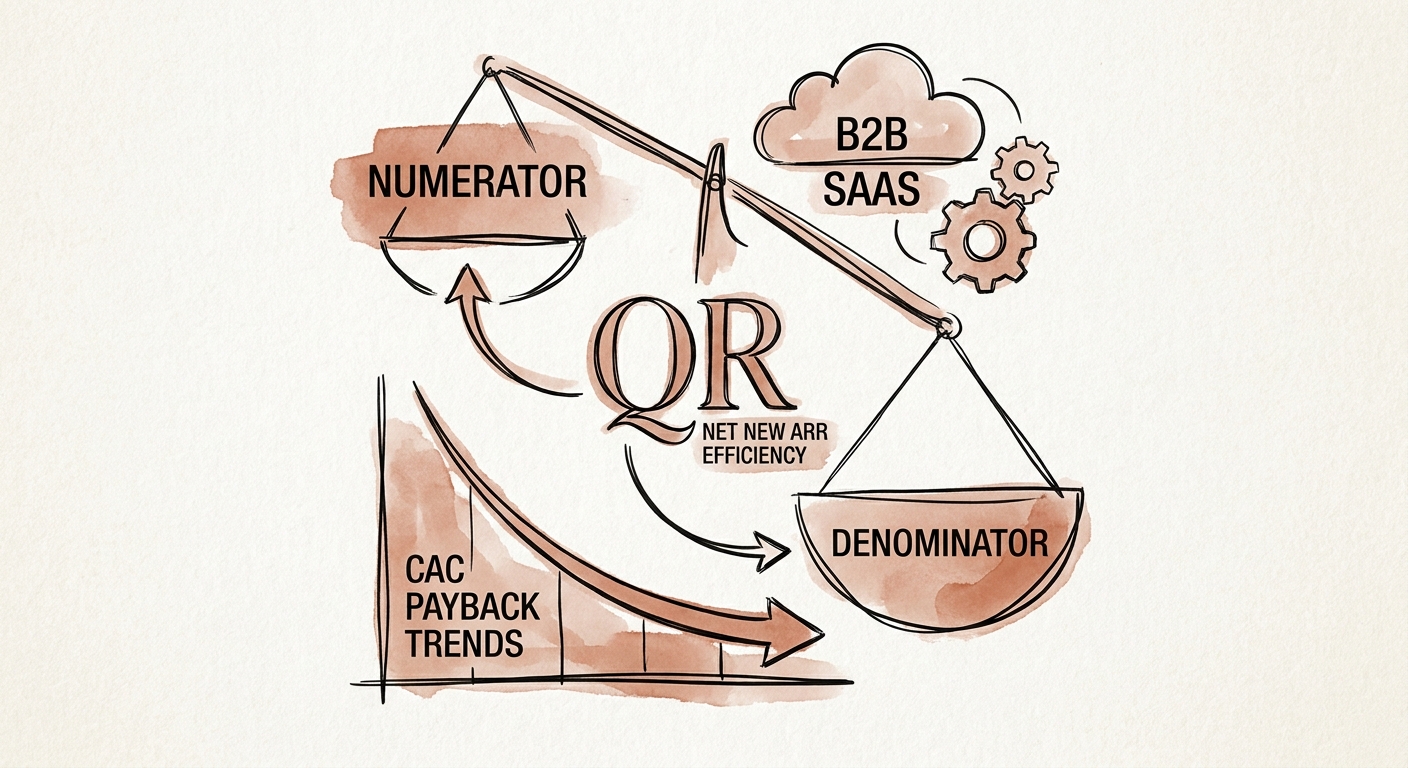
You cannot fix an inefficient Quick Ratio simply by asking the sales team to sell more. You must repair the denominator: churned ARR plus contraction ARR. Too many scaling SaaS companies bury seat reductions, usage downgrades, and discount-driven renewals inside complex contract reporting. That deferred reality surfaces during Quality of Earnings analysis and technical revenue diligence.
RevOps should recognize churn and contraction when the customer signals intent, not only when the contract officially expires. Finance should separate logo churn, gross revenue retention, net revenue retention, and contraction by segment. Product and customer success should be accountable for the cohorts creating the denominator, not just sales for filling the numerator.
To stabilize the Quick Ratio, align go-to-market compensation around net revenue retention and profitable growth, not just gross bookings. Use cohort analysis to make sure The Blended NRR Trap is not hiding a structural flaw in SMB while enterprise accounts prop up the average. The objective is simple: show the unit cost and durability of every dollar gained and lost.