
The practical answer
- Short answer
- A 115% NRR can hide a 30-point churn problem in $10M-$50M SaaS. Justin Leader shows the GRR math that decides whether your expansion revenue survives diligence.
- Best fit
- Industry: B2B SaaS. Function: Revenue Operations & Customer Success
- Operating path
- Unit Economics → Commercial Performance → Transaction Advisory Services
- Key metric
- 91% Median Gross Revenue Retention (GRR) floor required before investing heavily in expansion strategies.
Two companies, same NRR, opposite futures
Put two $30M ARR software companies side by side. Both report 112% Net Revenue Retention to the board. Both put it on the cover of the deck. Six months into diligence, one trades at a premium and the other gets re-traded down or walks. The difference isn't the NRR number they share — it's the number neither of them put on the slide: Gross Revenue Retention. Company A keeps 94 cents of every existing dollar before a single upsell. Company B keeps 82. Company A is compounding. Company B is running on a treadmill that speeds up every quarter.
Here's the mechanic founders miss. NRR nets your churn and your expansion into one figure, so a strong upsell motion can paper over a serious leak. If your gross retention is 82%, you start the year already down 18 points — which means you have to manufacture 30 points of expansion just to show a 112% headline. Prospeo's 2026 account management analysis states it plainly: NRR above 100% only tells you you're growing inside the base, but a GRR below 90% means that growth is sitting on an eroding foundation. The headline can stay green for a year, maybe two, while the floor underneath it caves.
The benchmarks make the stakes concrete for exactly the band most of these companies live in. SaaS Capital's 2026 data puts median NRR for scaling B2B SaaS ($3M-$20M ARR) at roughly 103%, with the 90th percentile near 118%. So a 112% report sounds top-decile. But median and 90th-percentile NRR can both be carried by very different GRR profiles — and an acquirer pricing your recurring revenue is going to separate the two in week one.
A 115% NRR built on 82% gross retention isn't growth — it's a clock counting down to the renewal where your biggest accounts finally read their own usage data.
Do this math before your next board deck
Take your current ARR base — say a clean $30M for the example. Pull two numbers your CS and finance teams already have: dollars lost to logo churn and downgrades over the trailing twelve months (that's your gross retention), and dollars added from upsell, cross-sell, and usage growth inside that same cohort (that's your expansion). Don't let anyone net them. Write them on separate lines.
If you lost $5.4M off the $30M base, your GRR is 82%. To still report 112% NRR, you had to add $9M of expansion — and most of it, in the companies I've assessed, comes from forcing your most entrenched accounts into bigger multi-year commitments precisely because they're too embedded to leave this quarter. That's borrowed revenue, not earned revenue. It shows up as a giant slug of expansion concentrated in a handful of logos, and a renewal cliff eighteen months out. Now run the healthy version: GRR at 94% means you only lost $1.8M, so the same 112% NRR requires roughly $5.4M of expansion — and it's spread across accounts that grew because they used more, not because they were cornered. Same headline. Completely different risk profile. One survives a procurement review; the other detonates in it.
This is why the only expansion number worth bragging about is the one sitting on a solid floor. Pavilion's 2025 B2B SaaS benchmarks show healthy companies generating about 40% of new ARR from expansion, climbing past 50% above $50M. That 40% is a signal of organic pull only when gross retention is intact underneath it. As an operator, I won't model a multi-product expansion strategy for a mid-market SaaS company until GRR clears roughly 91%. Below that, you're not building an expansion engine — you're financing churn with upsell, and the bill comes due at renewal.
Fix the floor first, then earn the expansion
If your GRR is the problem, no expansion playbook saves you — it just delays the reckoning. Start by quarantining the leak. Pull your trailing-twelve-month losses and sort them by reason, not by account size: did they leave because the product never got adopted, because a champion left, because pricing outran value, or because a competitor genuinely won? Three of those four are operational failures you control. Most companies discover that half their "churn" is really un-adopted accounts that never lit up the core product before someone tried to sell them a second one.
Then change what your CS team is paid to do for the first stretch of a contract. We deploy a health model that takes revenue off the table for roughly the first six months — no expansion conversation allowed. The team's only job is to drive the leading indicators that actually predict retention: depth of feature use, frequency of the economic buyer logging in, and the velocity at which a customer puts their own data into the product. An account only becomes eligible for an expansion conversation once those turn green. Push an upsell into a structurally red account — even one where the sponsor loves your rep — and you are buying a logo back one quarter early so you can lose it for good the next. That's the difference between a real expansion motion and what I'd call expansion theater.
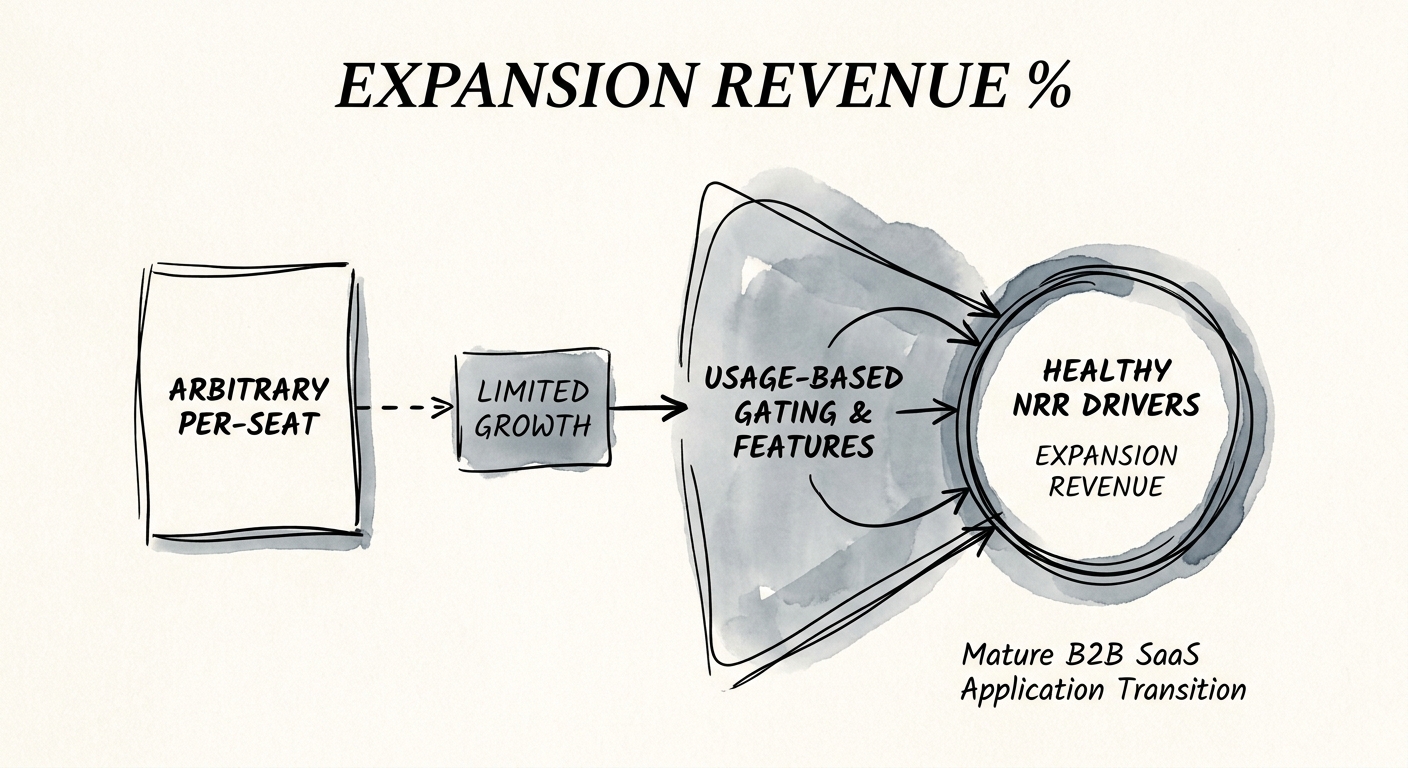
Only once the floor holds do you re-engineer how expansion gets earned. Per-seat pricing caps your growth at your customer's hiring plan; usage-aligned tiers, API volume, or value-correlated feature gates let an account grow because it's getting more out of the product, at a fraction of the cost of net-new acquisition. The pattern that holds up in diligence is always the same: expansion gets pulled by the customer hitting real value, never pushed by your forecast gap. Two practical next reads — get the denominators right in how to calculate Net Revenue Retention, and pressure-test the bookings feeding your model against pipeline that will never close. Fix the floor, and the 40% expansion number stops being a story you tell the board and starts being a moat an acquirer pays for.