The practical answer
- Short answer
- The exact top-10 customer ARR concentration a $10M-$50M SaaS company can carry at each stage before buyers apply a 15-20% valuation haircut, and how to fix it.
- Best fit
- Industry: B2B SaaS. Function: Revenue Operations
- Operating path
- Unit Economics → Commercial Performance → Transaction Advisory Services
- Key metric
- 12-18% Optimal Top-10 ARR Concentration at $15M-$50M Scale
The Number a Buyer Calculates Before They Read Your Deck
Sort your customers by ARR, largest to smallest. Add up the top ten. Divide by total ARR. That single percentage decides more about your exit multiple than your growth rate, your net revenue retention, or the slide where you explain why you're category-defining. A diligence analyst runs that calculation in the first hour of a process, and if the answer comes back north of 25%, every subsequent number you present gets read through a discount lens.
Picture a $25M ARR data infrastructure platform that just doubled revenue by landing three logos everyone in the building recognized. The founders treated it as validation. Then the math surfaced: those wins pushed the top ten to 42% of ARR, with two single accounts above the 10% line each. A buyer doesn't see momentum in that table. They see a cash-flow model where one departed champion at one account triggers a covenant breach. PitchBook's Q1 2026 Private Equity Deal Metrics shows institutional buyers applying an automatic 15% to 20% enterprise value discount the moment top-10 concentration crosses 25%. That isn't a negotiating posture. It's the model output.
The frustrating part is that concentration is the one risk you can't talk your way out of. You can reframe a soft quarter or a key-person dependency. You cannot reframe a revenue table that prints itself from your billing system. EY Parthenon's 2025 SaaS Revenue Quality Benchmarks puts the comfortable top-10 band for a $10M-$50M ARR company between 12% and 18%. Above that, buyers stop asking how big your accounts are and start modeling what happens when they leave. Our B2B SaaS customer concentration analysis walks the dollar mechanics of how that single percentage erodes founder equity at close.
A whale isn't a trophy. It's a single point of failure that a buyer will price into their opening bid, and you handed them the spreadsheet to do it.
The Same Concentration Is a Feature at $4M and a Felony at $20M
Here's what makes this metric genuinely hard to manage: the acceptable number isn't a constant, it's a function of your ARR. The concentration that earns you a Series A is the exact concentration that kills your Series C. Most founders never recalibrate because the spreadsheet that worked last year is still open on their desktop.
Below $5M ARR, a top ten that eats 40% to 60% of revenue is just what early traction looks like. No serious investor penalizes a seed-stage company for landing its first believers and serving them obsessively. The trouble starts in the stretch from roughly $5M to $15M, the band where the rules quietly invert. This is where you have to actively engineer dispersion to drag top-10 below 30%, and where most teams discover they've been optimizing for the opposite. Gartner's 2026 B2B SaaS Customer Health Benchmark found Series B companies carrying more than 30% of ARR in their top ten take 45% longer to close their next round, because every concentrated account becomes its own downside model the investor has to build. There's an operational tax too: whales demand bespoke features, and a roadmap hijacked by three accounts is a SaaS company slowly mutating into a services firm with worse margins.
Cross $15M ARR and the standard turns clinical. Now the top ten needs to sit under 20%, and any single customer above 5% of revenue becomes a line item in the buyer's risk memo, mined straight out of your revenue quality due diligence. This is not advisory caution. KPMG's 2026 Technology M&A Due Diligence Report attributes 68% of failed mid-market technology transactions primarily to unmitigated revenue concentration. Run your own table against these three bands. If you're at $18M ARR with a 28% top ten, you're not unlucky, you're playing by Series A rules in a Series C process.
You Fix It by Diluting, Not by Firing
The instinct to "reduce concentration" by walking away from a big account is backwards. You don't shrink the numerator, you grow the denominator. The fastest lever is comp. Most concentrated SaaS companies pay sales on contract size, which is exactly how you end up whale-heavy: a rep will always chase the $250K enterprise deal over the $50K mid-market one when the commission scales with ACV. Invert it. Say a rep lands a $50K mid-market deal that closes in 45 days and another grinds a $250K enterprise deal across nine months. Pay the faster, smaller deal a higher commission rate per dollar. Within two quarters your pipeline repopulates with repeatable, low-risk logos that dilute the giants without you ever sending an off-boarding email.
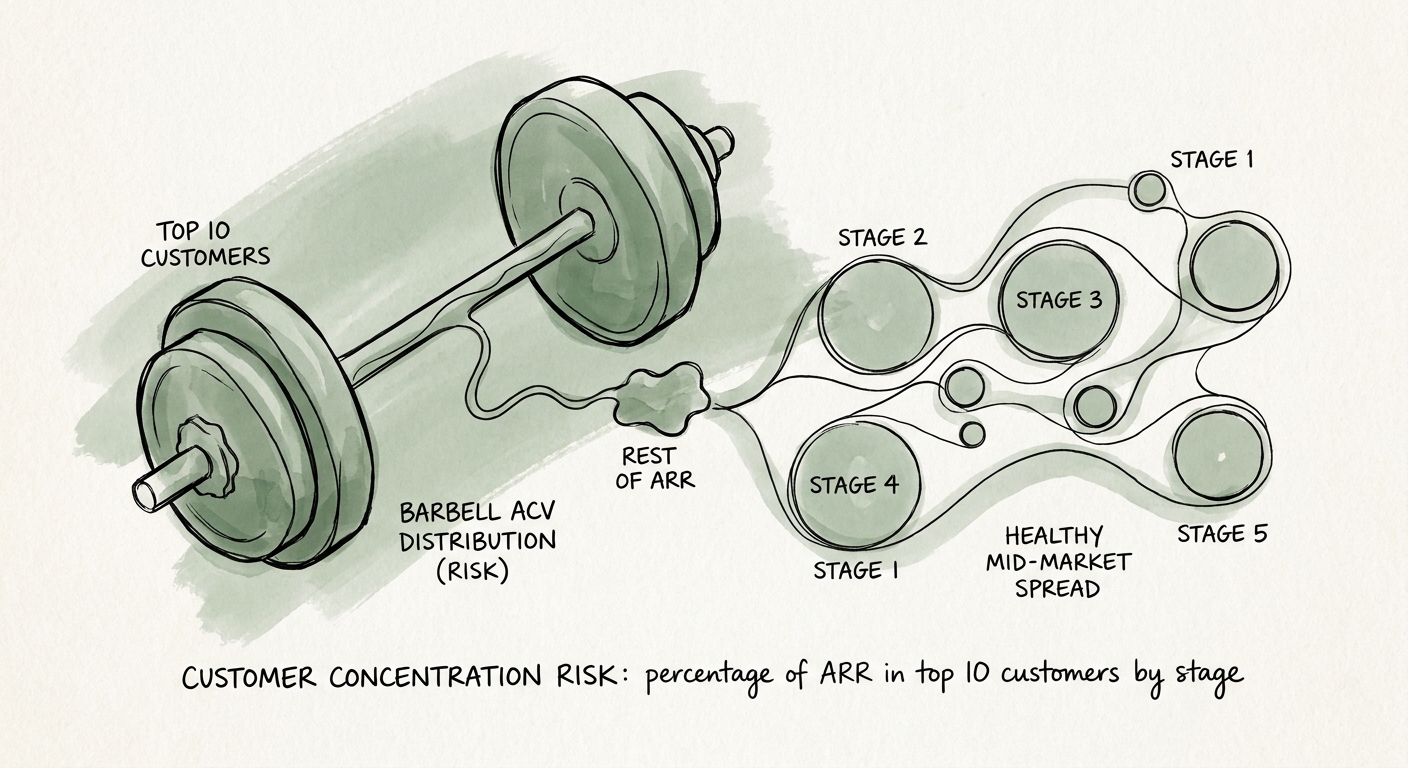
What you're really fixing is a shape problem. Plot your deals by ACV and concentrated companies almost always show a barbell: a cluster of $300K monsters on one end, a scatter of $10K pilots on the other, and a hollow middle where durable revenue should live. We dig into why founders misread their vertical SaaS ACV distribution and mistake a barbell for a healthy spread. The fix is a deliberate mid-market wedge: a packaged entry point in the $40K range that requires zero custom engineering and routes around procurement, so it actually closes fast enough to move the distribution.
The payoff is measurable, not theoretical. Bain & Company's Global Private Equity Report 2026 found portfolio companies running a dedicated mid-market wedge cut top-10 concentration by an average of 900 basis points over an 18-month hold, worth roughly 1.5 turns of EBITDA at exit. Here's your Monday: pull the ARR-sorted top-10 table, mark every account above 5%, and check whether your comp plan rewards the deals that would dilute them or the deals that made them. If the answer is the latter, you've found the first thing to change, and you have 18 months before a buyer finds it for you.