The practical answer
- Short answer
- Marketing-sourced SaaS pipeline closes near 11% while outbound clears 28%. Here's the source-level math $10M-$50M ARR boards keep getting wrong, and how to fix it.
- Best fit
- Industry: B2B SaaS. Function: Revenue Operations
- Operating path
- Unit Economics → Commercial Performance → Transaction Advisory Services
- Key metric
- 2.5x The multiplier by which outbound, sales-sourced pipeline win rates typically exceed inbound, marketing-sourced win rates in enterprise B2B SaaS.
Two columns in the CRM, two completely different businesses
Pull up your closed-pipeline report and add one column you probably don't have: origination source. Not "channel," not "campaign" — who actually created the opportunity. Then watch what happens to your numbers. In a recent audit of a $45M ARR SaaS company, the CMO walked into the QBR with a slide everyone loved: marketing had generated 48% of the quarter's pipeline. Balanced engine, scalable, no single point of failure. Then we traced those exact opportunities to the closed-won ledger. Marketing-sourced deals were closing at 11.4%. The outbound pipeline the enterprise AEs built — just 32% of total volume — was closing at 28.7%. Same CRM, same sales team, same quarter. Two businesses wearing one win rate.
This is the trap specific to companies between $10M and $50M ARR. You're past the founder-sold phase, so you've hired a demand-gen team and bought the volume tooling. But you haven't yet built the Revenue Operations muscle to question where pipeline comes from. So the board sees one blended number, funds the channel that produced the most volume, and the marketing CAC quietly burns cash at twice the rate of the outbound motion. Nobody's lying. The reporting structure is.
The reason the gap is this wide is structural, not a marketing-execution problem. The Gartner B2B Buying Report puts the modern enterprise purchase at roughly 11 distinct interactions across a committee of six to ten stakeholders. A prospect who downloads an ebook or attends a broad webinar has completed maybe two of those, and none of them touched the actual budget holder. An AE who multithreads into a target account has validated budget, authority, and timing before the opportunity ever reaches the CRM as qualified. You are comparing a deal that started at interaction two against one that started at interaction seven. Of course they don't close at the same rate. The mistake is dropping both into the same forecast column and pretending the average means something. Before you trust any of it, audit the records and stop recognizing pipeline that will never close.
Blended win rate is the most dangerous number in your board deck. It is the average of a channel that works and a channel that doesn't, and it tells you to do more of both.
What "healthy" actually looks like at your stage
Here are the source-level conversion bands I hold $10M-$50M ARR companies to in 2026 — not the 2021 numbers, when zero-interest money meant buyers approved software on a whim. Marketing-sourced pipeline should close at 14% to 18%. Outbound sales-sourced should hit 24% to 30%. Partner and ecosystem-sourced deals, where a trusted third party has already done your qualification for you, should clear 35%. If your marketing-sourced number is sitting below 10%, you don't have a marketing efficiency problem — you have a calendar problem, because every one of those deals is an AE discovery call that goes nowhere.
The velocity gap compounds the win-rate gap, and that's the part finance usually misses. The Ebsta 2026 B2B Sales Benchmark Report shows sales-sourced deals moving through the mid-funnel about 55% faster than inbound. So the marketing deal isn't just less likely to close — it sits in the pipeline longer while it fails, consuming AE hours the whole time. Two opportunities, identical deal size, one closes in roughly half the cycle at more than twice the rate. Blending them into a single "win rate" for the board isn't a simplification. It's an error that makes your forecast unbuildable.
Run the per-deal math and the "cheap lead" story collapses. Say an MQL costs you $500 and converts to closed-won at 11%; the fully loaded cost per closed deal is over $4,500. A sales-sourced appointment that costs $2,000 to generate but closes at 28% lands under $7,200 — but it closes faster and ties up far less AE time on the way. Once you add the hidden tax of selling time burned on dead-end inbound, the gap narrows or flips entirely. The headline price of a lead tells you nothing; the cost per closed dollar tells you everything. This is the same distortion you see in the recent B2B SaaS CAC benchmarks — acquisition cost is rising across the board, but it's rising fastest for inbound motions leaning on saturated paid channels.
The Monday fix: coverage ratios and comp, in that order
Start with pipeline coverage, because that's where the source mix silently breaks your plan. A 3x coverage ratio is fine if your pipeline closes at one rate. It is a hidden miss if 70% of that pipeline is marketing-sourced and closing at 13% while you modeled the whole thing as if it closed at 26%. Do the arithmetic: a heavily inbound-weighted book needs 5x or 6x coverage to hit the same number a balanced book hits at 3x. If your RevOps team isn't weighting coverage by source, your "we're covered" status update is fiction, and you'll find out in week eleven of the quarter when there's no time to fix it.
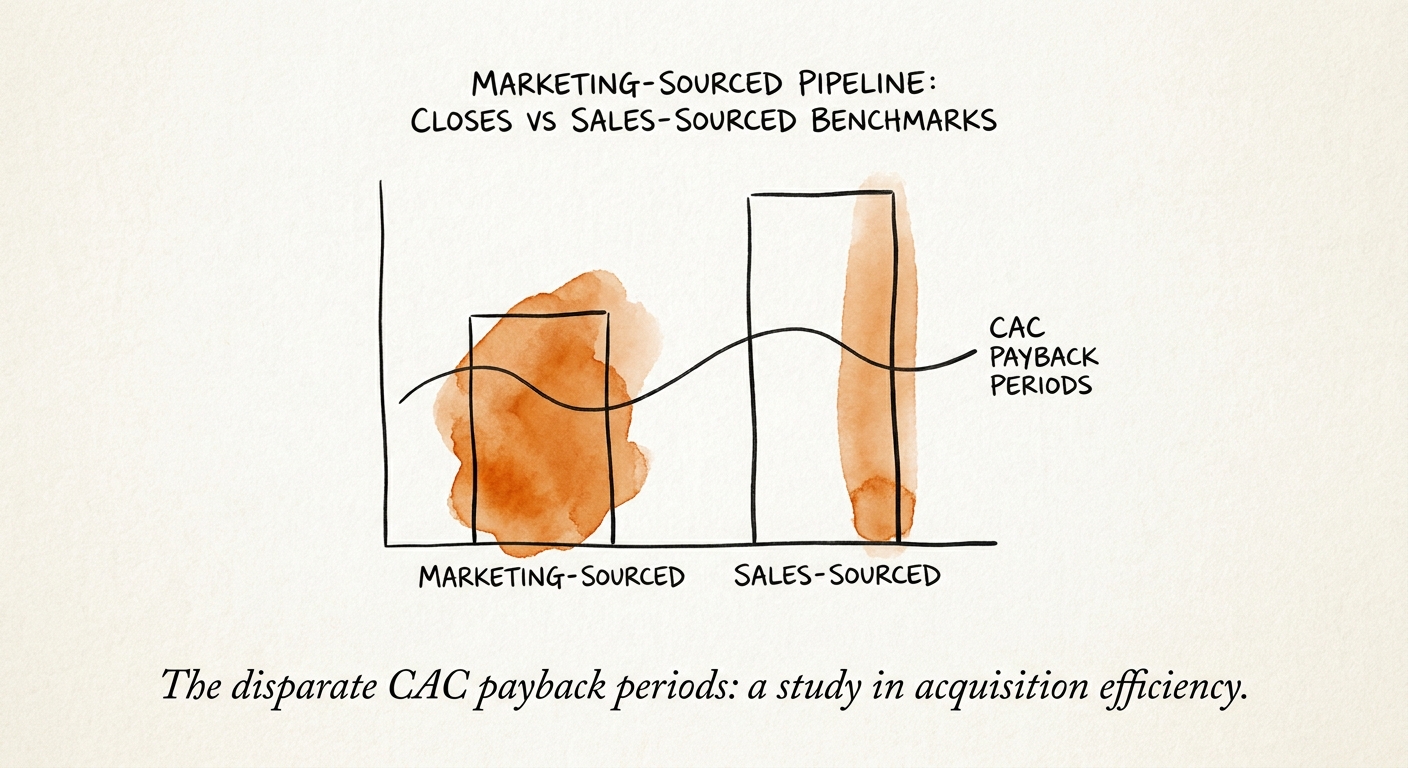
Then isolate CAC by source. The KeyBanc Capital Markets SaaS Survey puts the median CAC ratio around $1.42 for every new dollar of ARR. That blended figure hides the same split as the win rate: run it source-by-source and the sales-sourced ratio typically lands near an efficient $1.15 while the marketing-sourced ratio balloons past $1.80 — and it's the $1.80 number a sophisticated acquirer will find in diligence and price into your multiple. To get this right, fully load the marketing team's cost against only the ARR marketing sourced and closed; the method is in how to calculate true CAC payback periods.
The durable fix is compensation, and it's the one most teams flinch from. As long as you pay marketing leaders on raw pipeline generated, you are paying them to manufacture the exact low-quality volume that's dragging your unit economics down — and they'll do it well, because they're rational. Move the target to sales-accepted pipeline and closed-won contribution. The week the metric changes, the vanity volume stops appearing and you start seeing what your demand engine is actually worth. One number, one source column, one comp plan that rewards revenue instead of activity. That's the whole turnaround.