
The practical answer
- Short answer
- The $1M ARR-per-AE benchmark is breaking Series B plans. The 2026 mid-market median is $640k. Here is the ramp math and segment mix that actually predicts capacity.
- Best fit
- Industry: B2B SaaS. Function: Revenue Operations
- Operating path
- Unit Economics → Commercial Performance → Transaction Advisory Services
- Key metric
- 36% Percentage of B2B software sales reps currently hitting their assigned quotas.
Open almost any Series B operating model and you will find the same line buried in the GTM tab: $1M in new ARR per Account Executive, fully ramped. It is the load-bearing assumption underneath the hiring plan, the burn forecast, and the valuation the founder is quietly building toward. It is also, for a mid-market SaaS company in 2026, roughly 56% too optimistic. Gartner's 2026 SaaS Sales Efficiency Benchmark puts the median ARR per mid-market AE at $640,000 — not because reps got lazy, but because the zero-interest-rate buying behavior that produced the million-dollar rep simply stopped existing.
Here is why the gap matters more for a Series B than for anyone else. A seed-stage company can fudge capacity with two founder-led deals. An enterprise incumbent has a brand that closes for the rep. The growth-stage company in between is the one that hires 12 AEs against a $1M number, models $12M of net-new, and then watches the actuals land closer to $7.7M once you account for the real median. That $4.3M miss is not a coaching shortfall you fix in QBRs. It is a planning error baked in before the first req was posted.
The execution data underneath the benchmark is worse than the headline. Forrester's 2026 Tech Sales Quota Attainment Data shows just 36% of B2B software reps are clearing quota. Sit with the distribution that implies. When only a third of the team hits target, your "median" rep is, almost by definition, a miss. So the company that benchmarks against $1M is not even benchmarking against its best people — it is benchmarking against a fictional rep who outperforms two-thirds of a real sales floor. I have walked into a $35M-ARR SaaS business where blended attainment looked healthy at a glance, then traced it to three accounts. Strip those three and the other fourteen reps were each carrying a cost line they were not covering. The board saw "on plan." The cohort data saw fourteen people consuming runway. For the mechanics of separating the carriers from the riders, see our revenue-per-rep breakdown.
]]>A $700,000 quota that 80% of your team hits beats a $1.2M quota that 20% hit. The first builds a forecast you can borrow against and sell on. The second builds a story you tell investors right up until the renewal cohort proves you wrong.
The instinct, when ARR per AE drops, is to assume the reps are weaker or the market is softer. Both are convenient and mostly wrong. The capacity leaked out through the calendar. McKinsey's 2026 B2B Go-To-Market Productivity Study clocks the average enterprise AE at 72% of working hours on non-selling activity — CRM hygiene, deal-desk approvals, security questionnaires, internal alignment calls, the slow grind of multi-threaded buying committees. That leaves 28% of a six-figure-OTE person's week actually in front of revenue. You did not hire a closer. You hired a project manager with a quota stapled on.
Now do the arithmetic that the board deck never shows. If selling time fell and your benchmark held at $1M, you are implicitly demanding that each rep produce more revenue per actual selling hour than they did at the ZIRP peak — in a market with longer cycles, more stakeholders, and harder technical validation. That is the quiet absurdity in most 2026 plans: lower throughput, higher per-unit expectation, same headcount math. The $640k median is not the floor of bad performance. It is what the calendar physically allows.
And the cost of pretending otherwise shows up in the one place that determines whether you get bought. S&P Global's 2026 SaaS Margin Analysis has sales and marketing consuming a record 52% of total ARR at growth-stage software companies. Half your revenue is spent acquiring the other half. When a diligence team models your business, they do not credit your $1M target — they credit your trailing actuals against your fully loaded GTM cost, and they discount hard for the gap. The over-assignment reflex makes it worse, not better: pile a 1.5x multiplier onto a team attaining 36% and you do not summon more revenue, you manufacture pipeline bloat and hire overlays, enablement, and SDRs to support reps who cannot close enough to justify the support. The trap is real enough that it earns its own teardown in our quota-multiplier analysis.
]]>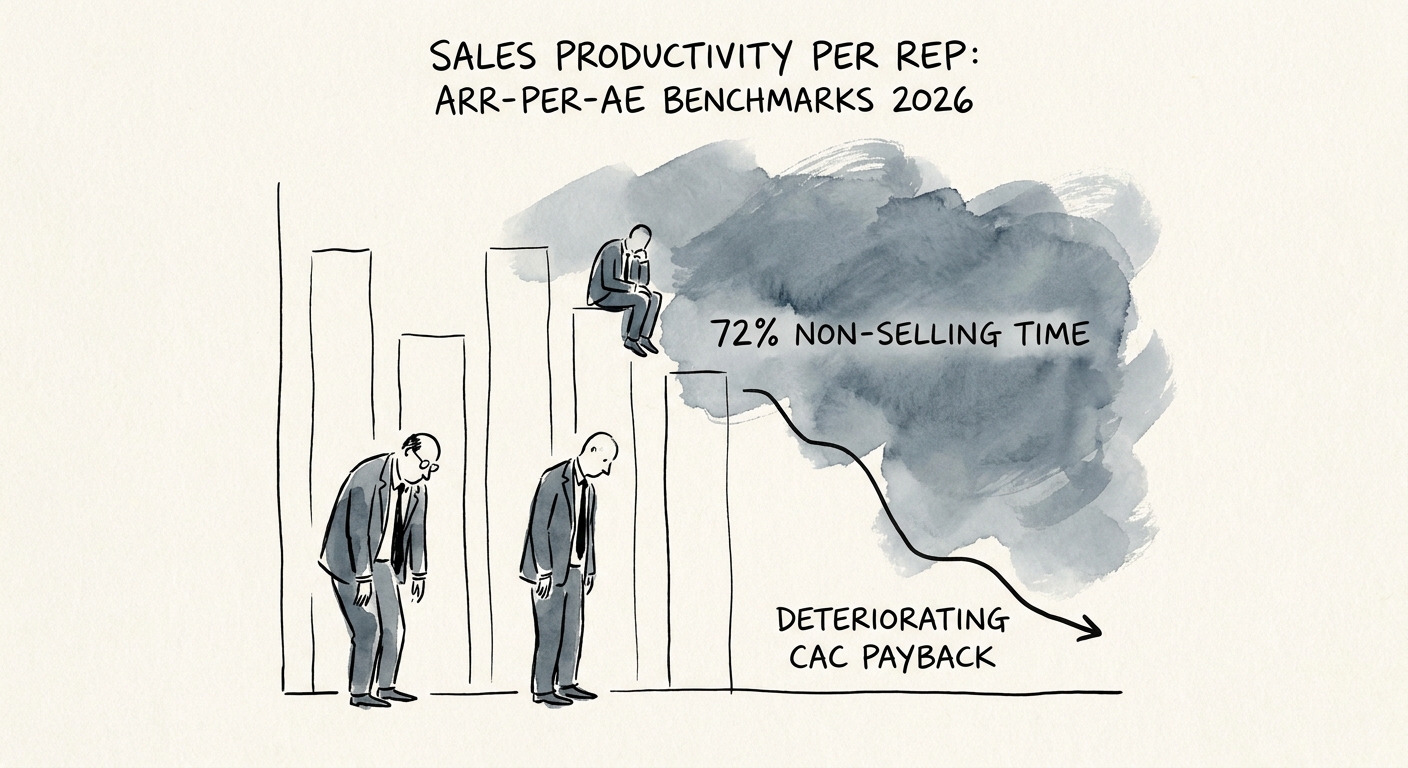
Stop planning to $1M and start planning to a number you can actually staff. The reframe is simple and most teams resist it because it feels like lowering the bar: a $700,000 quota that 80% of the team hits is a better business than a $1.2M quota that 20% hit. The first gives you a forecast a lender or buyer will underwrite. The second gives you a forecast that survives exactly until the renewal cohort comes due and the concentration shows. This matters in 2026 specifically because the cost of being wrong has lengthened — Bain's 2026 Software Industry Unit Economics Report puts the average B2B SaaS CAC payback at 22 months. If your reps churn before month 22, you are not running a sales org. You are running a subscription service that pays to lose money on every customer.
Three moves, in order, for a growth-stage team. First, set capacity bottom-up: take the $640k mid-market median, adjust for your actual segment mix and ramp curve, and never let a top-down board number override what a real calendar can produce. A rep working 28% selling time has a knowable ceiling — model that, then close the gap by giving time back, not by raising the quota. Second, attack the 72%. Every mandatory CRM field, every deal-desk gate, every approval step is a tax on the only 28% that generates revenue; rebuild the deal desk to serve the rep instead of the org chart. Third, reset the OTE-to-quota ratio to the capacity you just defined rather than the fantasy you inherited — the stage-by-stage math is in our OTE-to-quota guide.
Then change what you measure. Blended ARR per AE flatters you by mixing self-sourced wins with inbound bluebirds, SDR-handed pipeline, and overlay-rescued deals. Strip those out and look at what each AE sources and closes on their own. The moment you baseline on that isolated number, the three-reps-carrying-fourteen pattern becomes impossible to hide — and you can finally decide who to invest in, who to coach, and who is riding the brand. The plan that survives diligence is not the ambitious one; it is the staffable one: fewer reps, lower nominal quotas, far higher attainment, and a capacity model built from the calendar up. Build that, and your next ARR-per-AE number is one you can put in front of a buyer without flinching.
]]>