
The practical answer
- Short answer
- The 5x OTE-to-quota rule breaks at every funding stage. Here's the realistic ratio for Seed, Series B, and PE-backed SaaS in 2026 - and the math behind it.
- Best fit
- Industry: Technology. Function: Revenue Operations
- Operating path
- GTM Execution → Commercial Performance → Performance Improvement
- Key metric
- 4.5x Realistic quota ratio target for Series B scale-ups in 2026.
The 5x rule isn't a benchmark. It's a guess that survived a free-money decade.
Picture a board deck for a $40M ARR SaaS company. The comp model is clean: $240K OTE per Account Executive, $1.2M quota, a tidy 5x ratio that matches every benchmark slide the CFO has ever seen. Looks like discipline. It isn't. Because two numbers underneath that ratio have moved, and nobody re-ran the model.
Win rates compressed as the deals got bigger and the buyers got more committees. And attainment slid - hard. The Bridge Group's SaaS sales data pegs average AE quota attainment around 42% in the current market (The Bridge Group). Sit with that. If your rep only realizes 42% of a $1.2M quota, you booked roughly $504K against a $240K cost of carry. The "5x" you put on the deck is a fiction. Your realized ratio is closer to 2.1x. The plan was never designed to be hit - it was designed to look fundable.
That gap is where the margin goes. When reps miss, the accelerator tiers above quota go unfunded, so your best people - the ones who actually clear plan - leave for somewhere the math pays out. You backfill at a recruiting premium, the new hire ramps for two quarters, and your blended attainment drops further. The 5x rule didn't cause the death spiral. Refusing to re-price it for a 42%-attainment world did.
A quota ratio isn't a rule you import - it's an output of three things: your win rate, your ramp curve, and who's actually building the pipeline. Copy the number without copying those three, and you're just paying reps to fail on a prettier spreadsheet.
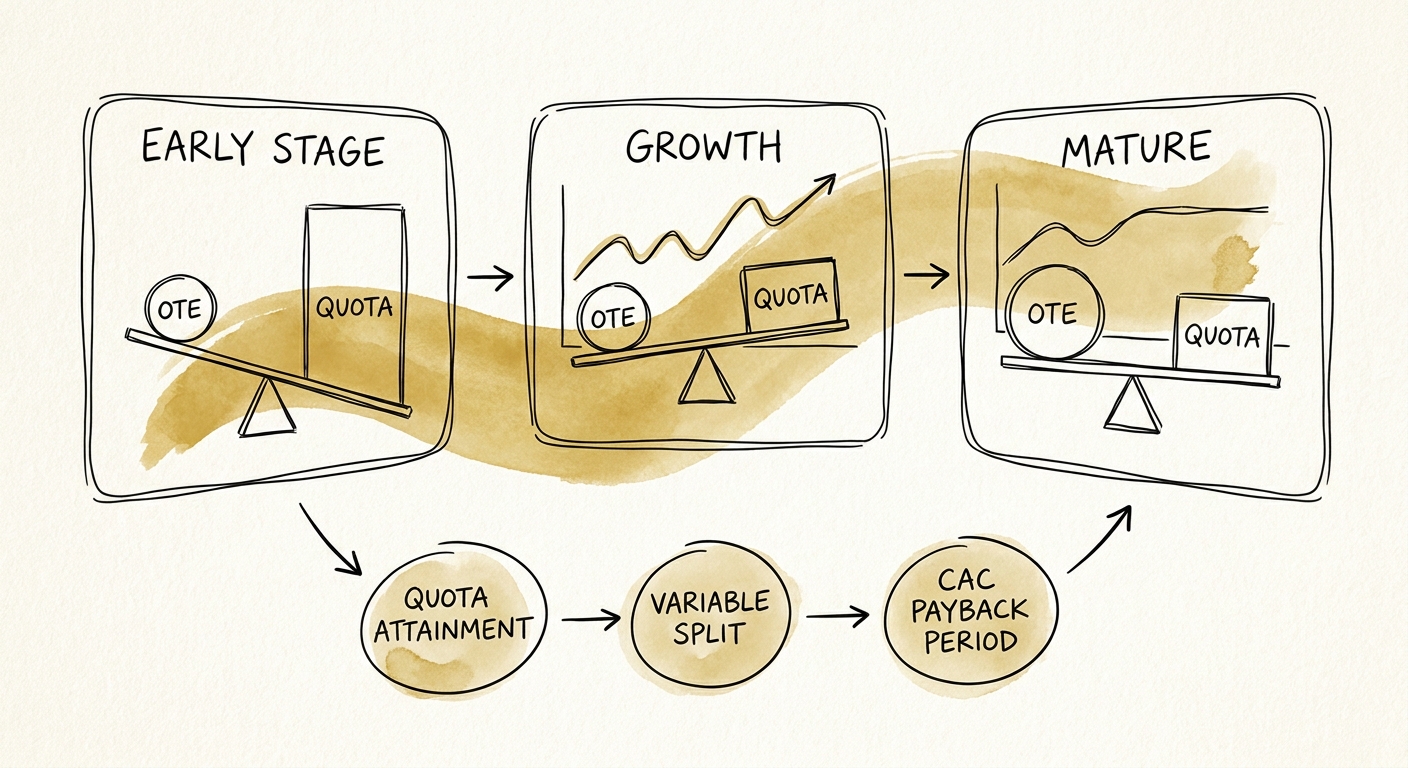
The right ratio is a function of who builds the pipeline - which changes at every stage
Here's the thing the static benchmark hides: an AE's capacity to close is inversely proportional to how much pipeline they have to build. The more a rep prospects, the less they sell, and the lower the sustainable quota multiplier. That's why the ratio has to climb as the company matures - not because of brand magic, but because each stage shifts pipeline work off the rep's plate. Walk it stage by stage.
Seed to Series A: the rep is the marketing department (3x to 4x)
No brand, no case studies, no SDR layer, no RevOps. Your AE is cold-calling, building their own list, and writing their own proof points mid-deal. They are spending half their week on work that has nothing to do with closing. Forcing a 5x ratio here isn't ambition - it's a turnover engine. A $150K-OTE rep carrying a realistic $500K quota (3.3x) is doing the actual job: finding repeatable motion. SaaS Capital's early-stage research is blunt that the priority at this point is proving a repeatable sales motion, not optimizing unit economics on a deal that doesn't exist yet (SaaS Capital).
Series B to Series C: the dangerous handoff (4x to 5x)
This is where comp models break, because this is where two stories collide. Later-stage investors now demand unit economics that make sense - so the instinct is to yank the ratio from 3.5x straight to 5.5x overnight. But the marketing engine is only half-built and you're hiring AEs faster than you can ramp them. A realistic landing spot is ~4.5x: a $200K-OTE rep on an $800K-$900K quota. You need the headroom because win rates predictably dip as you sell past the early adopters who said yes to anything, into a market that asks for references and a security review.
PE-backed and mature: the brand does the prospecting (5x to 6.5x+)
By the time a PE platform owns the asset, marketing, customer success, and channel should be generating high-intent pipeline so the AE spends their day in deal cycles, not at the top of the funnel. Now 5x to 6.5x is fair - it's the return on a real demand machine. The Alexander Group's compensation research is explicit that the orgs sustaining 6x+ ratios do it by using revenue operations to strip non-selling work off the rep (Alexander Group). The ratio isn't earned by maturity. It's earned by what maturity lets you take off the rep's calendar.
Three tests to run before you sign next year's comp plan
The benchmark tells you the target. These three checks tell you whether your plan can actually land there - or whether you've written a 5.5x quota that physics rejects.
Test 1: Multiply the quota by your real ACV and count the deals
Say a hunter demands a $150K base. Run a 50/50 split and the OTE is $300K; at a PE-stage 5.5x that's a $1.65M quota. If your average contract value is $30K, that's 55 closed deals a year. With a six-month sales cycle, no human being clears it - the pipeline math forbids it. Before you finalize any OTE, divide the implied quota by your ACV and stare at the deal count. If it's physically impossible, the ratio is fiction and you'll learn that in Q3 when nobody's at plan.
Test 2: Match the ratio to who's funding the pipeline
You can have a 6x ratio or you can starve the SDR and marketing budget. You cannot have both. The most common self-inflicted wound I see is a sponsor demanding a 6x quota while quietly cutting top-of-funnel spend - which pushes prospecting back onto the AE and silently drops the sustainable ratio to 4x. The quota on the comp plan doesn't move; the rep's actual capacity does, and the gap shows up as a CAC payback number that lies to you about how efficient your sales motion really is.
Test 3: Price the ramp, not just the steady state
Your blended ratio is always lower than your fully-ramped ratio, and a fast-hiring Series B has a huge slice of its team on draw or reduced quota at any moment. Annualize OTEs against fully-ramped quotas and you'll flatter your efficiency by a wide margin - a gap any decent diligence team finds in an afternoon. Calculate the effective ratio on ramped rep-months, and design plans that taper the draw as the quota expectation climbs, so a rep is contributing to margin by month six instead of riding a guarantee.
The whiteboard era of "5x and hope" is over. Pick the ratio your stage can actually support, stress-test it against your ACV and win rate before it's signed, and protect the margin yourself - because if you don't, the market will do it for you, and it won't be gentle.