The practical answer
- Short answer
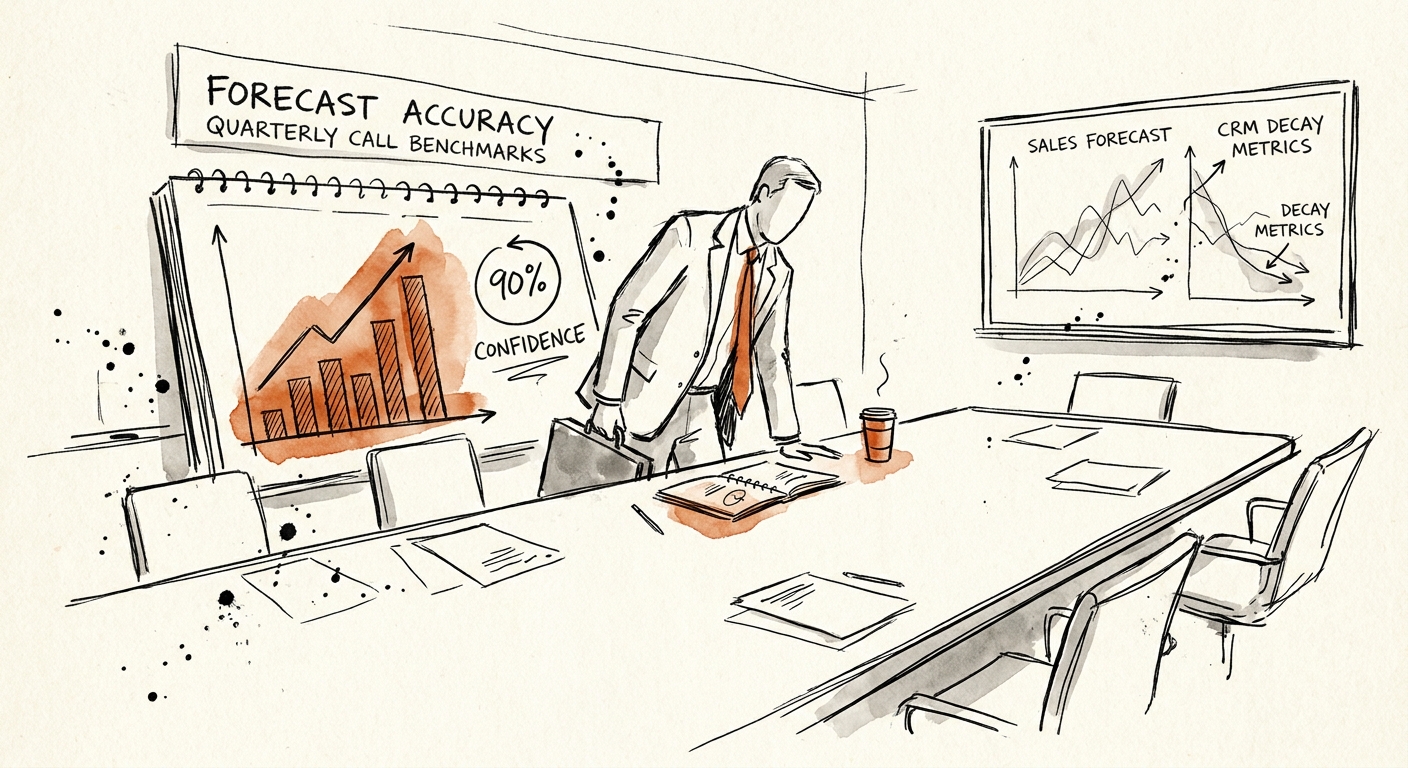
- Two missed quarters can cost a SaaS company a double-digit valuation haircut. Here is the 90% confidence forecast a PE operating partner expects on the board call.
- Best fit
- Industry: B2B Software. Function: Revenue Operations
- Operating path
- GTM Execution → Commercial Performance → Performance Improvement
- Key metric
- 90% Confidence threshold required for any deal logged as a baseline commit in the board forecast.
The number that cost a clean board call
Picture the second board call after close. The CRO of a $40M B2B SaaS company opens with a slide: 3.2x pipeline coverage, "strong commit," confident tone. Eleven minutes later the deal is in a quiet panic, because someone on the board asked a single question the forecast could not answer: of the deals you called "commit" last quarter, how many actually closed in the quarter you committed them? The honest answer was 61%. That gap — the distance between what the CRM said and what the bank account received — is the entire conversation. Everything else on the deck is decoration.
Here is why a PE operating partner cares so much about that one ratio. A mid-market SaaS business is bought and sold on the predictability of its revenue, not the size of it. Miss the forecast by more than ten points two quarters running and you have not lost a quarter — you have re-rated the asset. The model the buyer used to underwrite the deal no longer holds, so they widen their discount on every future cash flow to compensate for the new uncertainty. In our diligence work that re-rating routinely lands around an 18% haircut, and it does not come back the next quarter you happen to hit. Trust is asymmetric: it leaves in one bad call and returns over four good ones.
The mechanical cause is almost always the same, and it is not a demand problem. Gartner's research on sales forecasting found that fewer than half of sales leaders have high confidence in their own forecast — and they still present it as fact to the board. The forecast is built on pipeline coverage (a quantity) and presented as accuracy (a probability), and those are not the same animal. A 3x coverage ratio stuffed with deals that have no named economic buyer is a 3x pile of optimism. Before any of our portfolio CROs touches a board deck, we run the Sales Forecasting Accuracy Audit to find out which commits would survive a stranger reading the CRM with no rep narrative attached. Usually about a third of them do not.
The board call is not where you find out if the number is real. It is where you prove you already knew. If your forecast and your three validation models disagree by more than five points, you are reading me a wish, not a commit.
What "90% confidence" actually has to mean in the CRM
A 90% commit cannot be a feeling a rep types into a dropdown. In a SaaS deal it has to be three verifiable facts that are either true or false, with no room to argue: a named economic buyer the rep has personally spoken with, a confirmed budget line for this fiscal period, and a mutual close plan with dated steps that both sides have agreed to in writing. If all three are true, the deal counts at 90% and lands in the baseline forecast. If even one is missing, it drops to 50% upside and stops touching the number you say out loud to the board. That single rule does more to clean a forecast than any new tool, because it converts "I think this closes" into "show me the budget line."
The second rule is about decay, not optimism — and it is the one reps fight hardest. Set a hard limit on stage age. In our portfolios, a deal that has sat in "Proposal Delivered" for more than 14 days with no scheduled executive sync gets pulled from the active forecast automatically, by the system, not by a manager's judgment. A proposal that has gone quiet for two weeks is not slow, it is dead and has not been buried. Stop letting reps hand-override probability percentages; tie probability to actions the buyer took, never to the charisma of the seller. Forrester's work on B2B sales operations ties disciplined, data-driven forecasting to materially higher win rates, and the reason is unglamorous: when stalled deals stop hiding in the forecast, reps spend their week on the deals that are actually alive.
Coverage still matters, but a flat 3x target is the lie most decks are built on. The required ratio has to flex by stage, because a deal in early discovery and a deal in final redlines carry wildly different odds of slipping. We hold early-stage enterprise pipeline to roughly 4.5x weighted coverage and let it narrow toward 1.5x once a deal is in legal review and the math is nearly certain. Stratifying coverage by where deals actually convert is the structural fix for what we call the pipeline coverage lie: you find out on day one of the quarter whether you have real coverage, instead of discovering on day 80 that 80% of your "pipeline" never had a pulse.
The Monday mechanic that makes the board call boring
The goal of the quarterly call is for it to be boring — a confirmation of something the room already trusts, not a reveal. You get there with one weekly habit. Every Monday, build the quarter's number three independent ways and force them to agree. First, the bottom-up rep commit: the sum of every 90% deal as defined above. Second, the top-down conversion model: take this quarter's stage-by-stage pipeline and apply your own trailing four-quarter conversion rates, not the rep's. Third, the product signal: for renewals and expansion, what does actual usage and engagement data say is likely to land? If those three numbers sit within five points of each other, you have a forecast. If they diverge by more, you do not have a forecast yet — you have three guesses, and the gap is telling you exactly where the optimism is hiding.
Then defend it deal by deal in a weekly revenue council. Make each rep walk a commit through the qualification frame out loud — economic buyer, budget, decision process, paper process, the parts people skip. When a deal slips, you do not roll it silently into next quarter; you run a short post-mortem on which qualification step lied, and you feed that back into the gate. This is the discipline behind McKinsey's finding that the most predictable sales organizations command meaningfully higher valuation multiples than their least predictable peers. Predictability is not luck. It is the same forecast surviving the same interrogation week after week.
Do that for a full quarter and the board call rewrites itself. Instead of a hopeful range, the CRO opens with a sentence the room can underwrite: "We are forecasting net-new ARR at 92% confidence, backed by late-stage pipeline that has cleared legal, with all three of our models inside five points." That sentence is what a buyer pays a premium to acquire, and it is the whole point of rebuilding a forecast that finally holds. Start this Monday: pull the last four quarters of "commit" deals, calculate how many closed in the quarter you committed them, and put that one number at the top of next week's revenue council. It will be uncomfortable. It is also the most honest slide you will produce all year.