The practical answer
- Short answer
- A blended win rate hides which sales motion is funding you and which is bleeding you. Segment inbound, outbound, and partner before a PE buyer does it for you.
- Best fit
- Industry: B2B SaaS & IT Services. Function: Revenue Operations
- Operating path
- GTM Execution → Commercial Performance → Performance Improvement
- Key metric
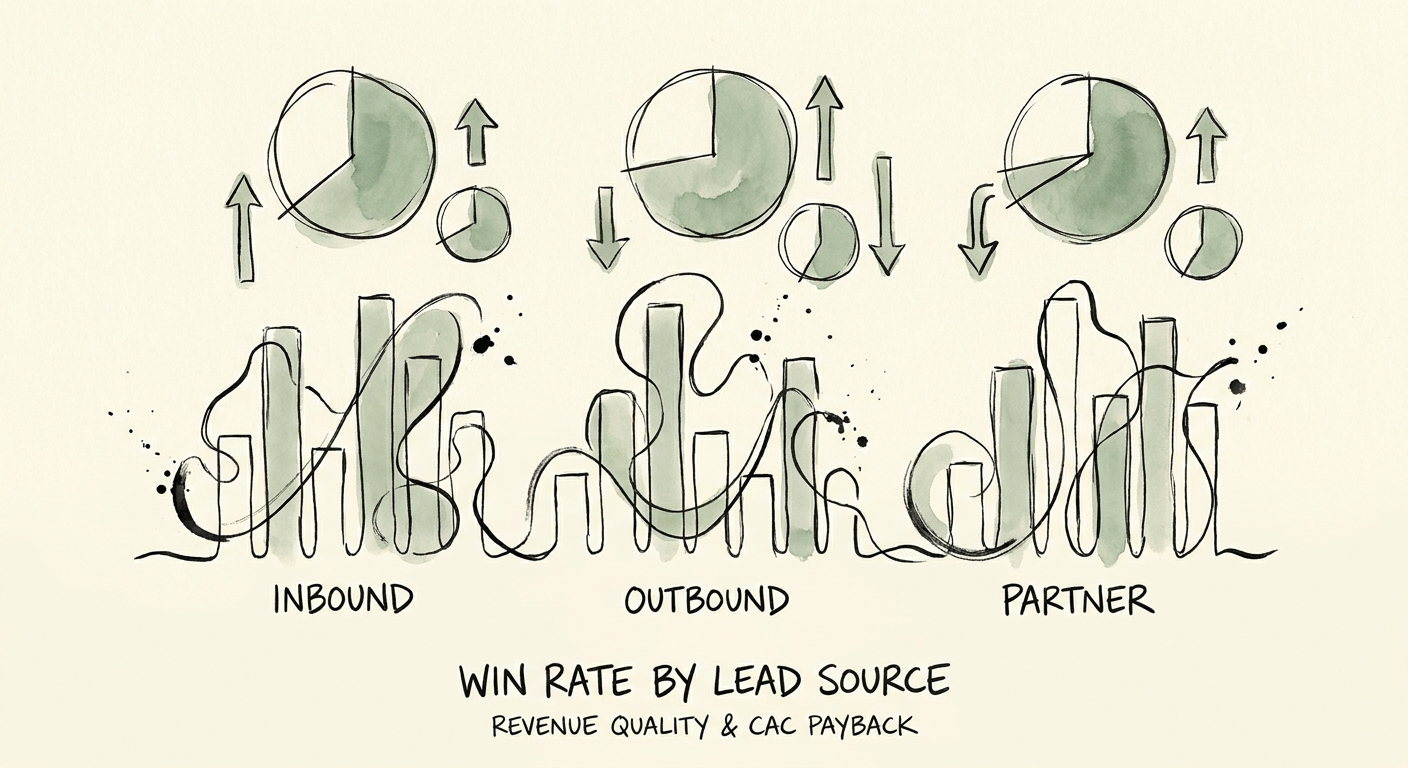
- 41% Average win rate for partner-sourced ecosystem deals in B2B SaaS.
The slide that survives every board meeting because nobody asks the right question
Picture a $45M ARR software company. The VP of Sales puts up one number — 24% win rate — and the room nods. It clears the bar everyone carries in their head, so nobody pulls the thread. But that 24% is an average of three motions that have nothing in common: high-intent inbound closing in the high twenties, partner introductions closing near half, and a cold outbound machine quietly closing at low single digits. Strip the partner deals out and the direct outbound number can land around 3%. At that rate you can spend well over $2M a year in SDR and AE comp to land a fraction of that in net-new ARR — and the blended slide will still read "healthy."
That is the trap. A blended win rate is true on average and false everywhere it matters. It tells you the building is at a comfortable temperature while one room is on fire and another has the windows open. You cannot manage a number that averages across motions with three different physics — different cycle lengths, different discount depths, different cost to acquire a dollar of revenue.
The reason this matters more in 2026 than it did three years ago is the buyer. Gartner's B2B buying research puts the typical buying group at six to ten people, each arriving with their own research and their own veto. A cold email lands in front of one of them and asks the whole committee to form around a stranger. A partner introduction walks in already trusted by the person who controls the budget. Those are not the same sale at different conversion rates. They are different businesses. Treating them as one currency is how a founder-CEO talks themselves into hiring the exact motion that is draining the company.
A blended win rate is the one number on the board deck that's true on average and false everywhere it matters.
The two illusions: outbound's collapse and inbound's hidden floor
Start with outbound, because that's where the cash leaks. The brute-force model — add ten SDRs, dial ten thousand prospects, harvest a handful of closed-won — assumed a buyer who'd take the meeting. That buyer is gone. When the decision sits with a consensus committee, cold outreach has to land with one person and then survive being relayed, secondhand, to nine others who never heard the pitch. Across the companies I've worked inside, the outbound close rate has fallen from low double digits a few years ago to low single digits now. So if your forecast assumes outbound-sourced pipeline converts at 20%, that assumption needs evidence it almost certainly doesn't have.
The damage compounds two ways. Outbound deals run a meaningfully longer cycle and demand a deeper discount to close, so each one costs more and returns less. And because reps know their job depends on the number, they nurse dead outbound opportunities through the stages — the phantom pipeline that detonates your quarterly forecast and corrupts the data your CRM was supposed to make trustworthy. The forecast misses, and you can't even tell which deals were real.
Inbound is not one number either
Marketing hands sales 500 webinar leads and books it as multi-million-dollar pipeline. Here's what that aggregate hides. Split inbound into high-intent — the demo request, the "contact sales" form, the person sitting on your pricing page — and low-intent, the eBook download and newsletter signup. High-intent inbound closes strong because those buyers diagnosed their own problem and showed up ready to sign. Content-led inbound closes in the low single digits because most of those people wanted a free PDF, not a contract. When marketing and sales never agree on what "intent" means, your best AEs burn their premium hours qualifying PDF-collectors — and that's how you end up diagnosing a sub-20% win rate that was never one problem to begin with. It was a high-intent motion working fine, dragged down by a low-intent motion mislabeled as pipeline.
Why a PE buyer cares more about your partner channel than your headcount
If outbound is the expensive way to buy revenue and inbound swings on intent you can't always control, partner-sourced pipeline is the motion with the best economics in the building. When a systems integrator, an MSP, or a non-competing software vendor brings you into their deal, they transfer their trust to you before the first call. Ebsta's B2B benchmark data shows win rates climb sharply when multiple stakeholders and external influencers are already engaged — which is exactly the starting position a partner deal hands you. These deals tend to close at multiples of the blended rate, move faster, and resist discounting, because when the integrator running a large implementation tells the buyer your product is required to make it succeed, the buyer isn't negotiating 10% off the software line. Forrester's work on the partner ecosystem multiplier frames why: ecosystem-led growth scales revenue without scaling headcount one-to-one, which is the definition of capital-efficient.
The diligence lens you should adopt now
This is the part founder-CEOs miss until it's expensive. A PE firm running a revenue quality assessment will not accept your blended number. They will deconstruct the CRM by source and ask one question: how dependent is this revenue on a low-converting, headcount-hungry outbound machine? If the answer is "most of it," they discount the multiple, because that revenue can't scale without linearly scaling cost. A growing partner channel tells the opposite story — the market pulls your product through trusted intermediaries, and growth doesn't require an army. That's what a premium multiple is paying for: predictability and efficiency, not raw bookings.
So do the unglamorous thing on Monday. Have RevOps split your pipeline into four buckets — Inbound (High Intent), Inbound (Low Intent), Outbound, and Partner — and assign each its own historical close rate in the forecast instead of one blended figure. The first run will be uncomfortable. You'll likely find one motion quietly funding the company and another quietly burning it, both hidden inside an average that looked fine on the slide. Better you find it this quarter than a diligence team finds it during your raise.