
The practical answer
- Short answer
- Your pipeline says you'll hit the number. You won't. A 25-metric audit and a 7-day pipeline purge for Series B/C founders, built on 2025 SaaS benchmarks.
- Best fit
- Industry: B2B SaaS. Function: Revenue Operations
- Operating path
- GTM Execution → Commercial Performance → Performance Improvement
- Key metric
- 43% Avg. Rep Quota Attainment (2025)
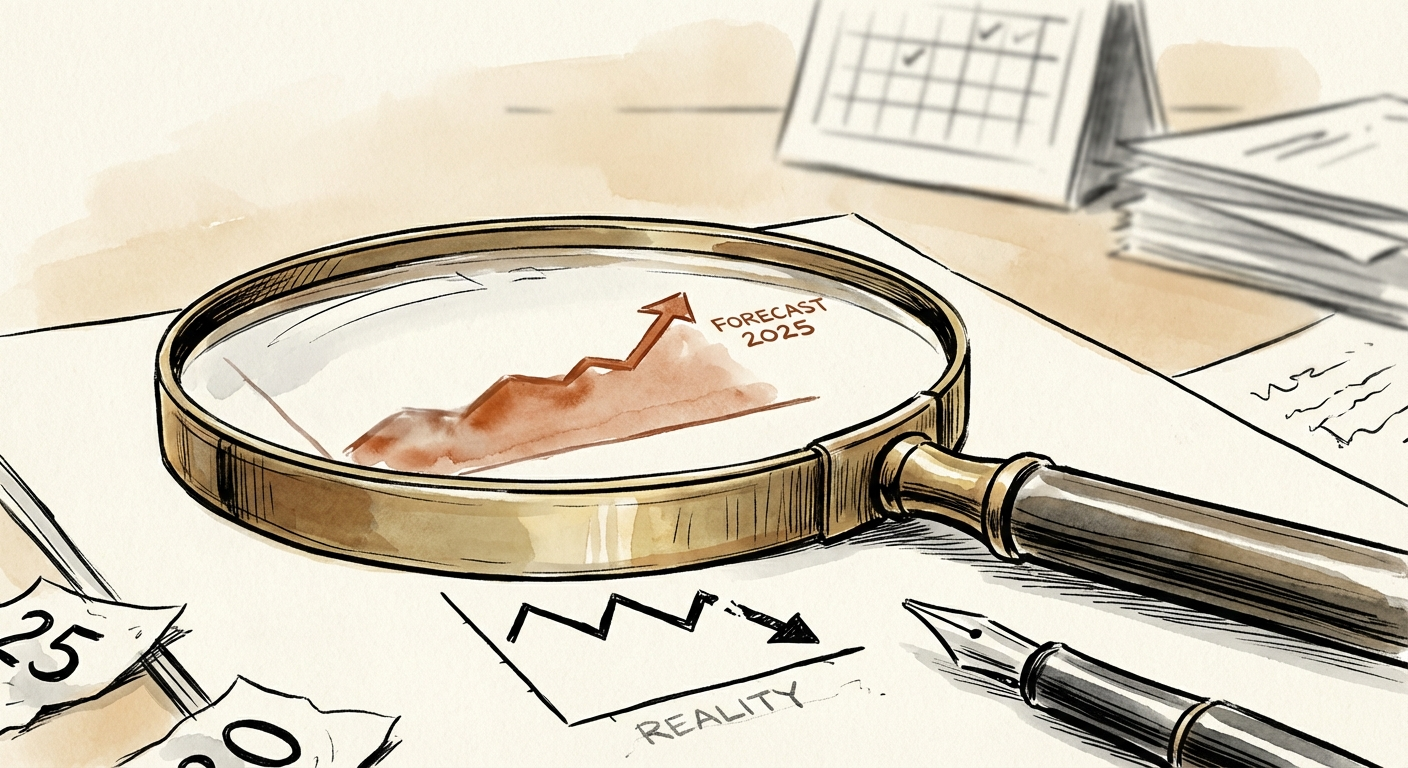
Friday's forecast call is a confidence ritual, not a measurement
It's Friday afternoon. The VP of Sales walks you through twelve deals, all "committed," all "verbally yes," all closing this quarter. The pipeline number is 3.5x the target. Everyone nods. Three weeks later, four of those deals slip to next quarter, two go dark, and you miss the number for the third quarter running. You raised a Series B on a story about repeatable, predictable revenue. The board is now asking whether "predictable" was ever true.
Here's the uncomfortable arithmetic underneath the optimism. Per RepVue's Q4 2024 Cloud Sales Index, only about 43% of B2B sales reps are hitting quota. Run that against your own org chart: if you've hired eight AEs at, say, $300K fully loaded each, the median outcome is that fewer than four are carrying their cost. The other half are a $1.2M annual line item producing forecast noise. At Series B you didn't have a sales problem when you had three reps and a founder who closed every deal personally. You manufactured one the moment you scaled headcount faster than you scaled the system those reps plug into.
Why "do more activity" makes it worse
The reflex when the number slips is volume: more dials, more sequences, more SDRs feeding the top of the funnel. But if the deeper problem is conversion deterioration or a 200-day cycle on six-figure deals, pouring leads into that machine just lengthens the queue and burns cash faster. You don't have an activity deficit. You have a revenue-quality deficit, and the two get confused because activity is easy to count and quality is not. The 25 metrics below exist to separate the deals your reps believe in from the deals that will actually wire money.
A pipeline is not an asset until it survives a purge. Everything that pushes its close date twice is a story your reps are telling you, not a deal.
The 25 numbers — and the four that the rest are downstream of
Most diagnostics hand you a wall of metrics and let you drown. Don't try to fix all 25 at once. Pull the four anchor numbers first — cycle length, CAC payback, win rate, and pipeline coverage-adjusted-for-junk — because almost every other metric here is a leading or lagging indicator of one of those. Benchmark scope below is B2B SaaS, Series B/C scale.
Velocity — is time on your side or against you?
- 1. Sales cycle length: ~84 days median; for ACV above $60K, plan on roughly 180. Source: Optifai's 2025 deal-cycle benchmarks. If yours is lengthening quarter over quarter, that alone explains the misses.
- 2. Time-to-first-deal for a new hire, and 3. ramp time: now ~5.7 months, up from 4.3 in 2020. If your cash model assumed a rep pays for themselves in quarter one, your runway forecast is fiction.
- 4. Stage duration (a deal parked in "Proposal" past 14 days is decaying), 5. deal velocity (Deal Size × Win Rate × Open Opps ÷ Cycle Length), and 6. lead response time — connect rate collapses if you don't reach a fresh inbound inside five minutes.
Efficiency — are you spending $2 to make $1?
- 7. CAC payback: under 12 months is best-in-class, 15–18 is median, past 24 is uninvestable. 8. Magic Number (target >0.75), 9. LTV:CAC (target >3:1 — but see why your CAC payback is lying to you), 10. Burn Multiple (<1.5 at Series B), 11. S&M as % of revenue (40–50% for high growth), and 12. rep utilization — only ~30% of a rep's time is actually spent selling. The other 70% is CRM hygiene and internal meetings you're paying AE rates for.
Effectiveness — where the skill gap hides
- 13. Quota attainment (43% per RepVue — and if 70%+ of your reps miss, the quota or the product is broken, not the people), 14. win rate (~21% overall, 30%+ for elite teams), 15. competitive win rate, 16. NRR (>110% enterprise, >100% SMB), 17. average discount (past 20% and your price list is a suggestion), and 18. forecast accuracy — see moving from guessing to 92% accuracy.
Pipeline integrity — the most edited dataset you own
- 19. Coverage (3–4x, but worthless if the pipeline is junk), 20. MQL→SQL (15–21%, usually your tightest bottleneck), 21. SQL→Opp (>40%), 22. Opp→Close (>25%), 23. stalled opps (no two-way activity in 30 days — purge on sight), 24. lead-source win rate, and 25. rep-free preference: Gartner found 61% of B2B buyers prefer a rep-free buying experience. Every friction step you add between intent and signature is conversion you're voluntarily forfeiting.
Seven days, three moves, one founder running it
This is not a project you hand to the VP of Sales who built the current pipeline — asking the author of the system to grade it produces the forecast you already don't trust. Block the week and run it yourself.
Days 1–2: Purge the pipeline against one rule
Every opportunity that has pushed its close date twice, or has had no two-way engagement (a reply, a held meeting) in 30 days, comes out of the forecast. No exceptions, no "but this one's special." Expect the total to drop 30–40%. That drop isn't a loss — it's the first time in a year you're looking at your real pipeline. Now recompute coverage. If you're suddenly below 3x against target, you have a top-of-funnel problem you'd been hiding under dead deals.
Days 3–4: Triage the reps by results, not effort
Sort the team on attainment and win rate. The top ~20% are hitting quota despite the system — your job is to remove whatever friction they name and then get out of their way. The middle group has activity but weak conversion; they need a documented playbook from the top group, not more pressure. The bottom group has been past the 5.7-month ramp window, isn't profitable, and absorbs a disproportionate share of management time. Decide on each one this week, not "next quarter."
Days 5–7: Build a fast lane for the buyers who don't want you
If your "Request a Demo" button routes a high-intent prospect into a BDR qualification call three days out, you're sanding the edges off your best leads. Give high-fit prospects a path to book directly with an AE, and start managing on response velocity instead of activity volume. Predictable revenue isn't luck and it isn't heroics — it's the result of measuring the four anchor numbers honestly and re-running this audit every quarter. The market stopped paying for potential a while ago. It pays for the deals that survive the purge.