
The practical answer
- Short answer
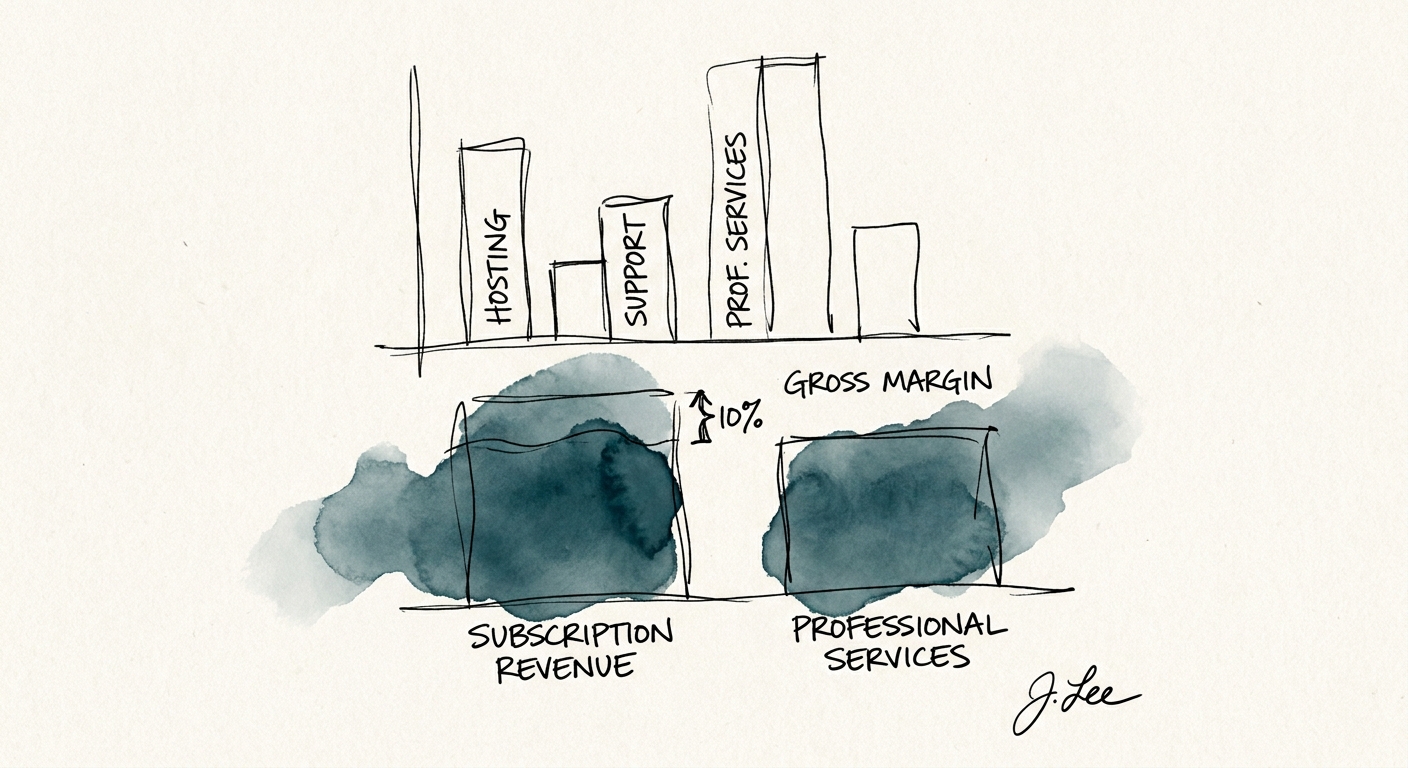
- That 85% SaaS gross margin is usually ~71%. Benchmark Cost of Revenue: hosting 8–12%, support 8–10%, PS near break-even — before diligence does.
- Best fit
- Industry: B2B SaaS. Function: Finance & RevOps
- Operating path
- Unit Economics → Commercial Performance → Transaction Advisory Services
- Key metric
- 71% Benchmark Blended Gross Margin for At-Scale SaaS
The 85% margin nobody actually has
Pull up your last board deck. Find the gross margin number. If it starts with an 8, I can almost guarantee that some of the people who deliver your product are sitting in the wrong column of the income statement. Not because anyone committed fraud — because the chart of accounts was set up by a founder in year two who put the implementation team under "operations" and never moved them.
Here is the mechanic that bites at exit. Cost of Revenue (the software world's name for COGS) is everything it takes to deliver the product a customer is already paying for: the cloud bill, the support queue, the engineer who does the data migration. Operating Expense is everything it takes to win the next customer and run the company. The line between them is not an accounting opinion you get to keep — it is the single largest determinant of your gross margin, and gross margin is what a buyer multiplies. Move a $4M support-and-implementation cost from OpEx into COR and the company didn't get worse; the P&L just stopped lying. But the printed margin drops, and the multiple drops with it.
The reason the 8-handle is fiction for most enterprise software is in the public comps. The Bessemer Cloud Index puts at-scale public SaaS Cost of Revenue around 29% — a blended gross margin near 71%. Those are companies with optimized infrastructure, mature support automation, and audited financials, and they still spend 29 cents of every revenue dollar on delivery. If a 40-person company with a hand-built onboarding process and a single Tier 3 engineer firefighting deployments is reporting 85%, the question isn't whether costs are hiding. It's where.
The honest move is to find them yourself, on your own timeline, before a diligence team reclassifies them for you and frames the swing as a discovery rather than a known feature of your business. That starts by breaking Cost of Revenue into the three buckets buyers actually scrutinize: infrastructure, support and success, and professional services.
A gross margin is just an opinion about where you filed your implementation engineers. Quality of Earnings turns that opinion into a fact, and the fact is usually 12 points lower than your deck.
Three buckets, three different diseases
Lumping everything into one COGS line tells a buyer nothing and protects you from nothing. Split it, and each bucket reveals a specific problem with a specific fix. A diligence analyst reads the splits to answer one question: does this thing scale with code, or with hiring?
Hosting and infrastructure — 8% to 12% of revenue
This is the cleanest bucket and the easiest to benchmark: cloud compute, storage, the data egress fees everyone forgets, and the third-party APIs you resell inside your product. For a real multi-tenant architecture this should land between 8% and 12% of revenue. Cross 15% and you don't have a cost problem, you have an architecture problem wearing a cost costume — usually single-tenant sprawl, an unoptimized data layer, or compute-heavy features you priced as if they were free. The tell is whether infrastructure cost grows linearly with revenue (fine) or faster than revenue (a margin leak that widens with every enterprise logo you add).
Support and customer success — 8% to 10% of revenue
This is where the misfiling happens, because Customer Success genuinely straddles the line and most companies put the whole team on one side out of convenience. Break-fix support, ticketing, the on-call rotation — that is unambiguously Cost of Revenue. CS is split work: the portion spent on onboarding, training, and keeping the customer live belongs in COR; the portion spent hunting upsell and expansion is a selling cost and belongs in Sales and Marketing. A CSM who spends three days a week renewing and rescuing accounts and two days quarterbacking expansion is a 60/40 allocation, not a single line item. If you've never made that split, you are either inflating gross margin (whole team in OpEx) or understating sales efficiency (whole team in COR). Before you allocate, sanity-check whether the team is even the right size against our customer success team size benchmarks — a bloated CS org makes the split look worse no matter which column it lands in.
Professional services — break-even to a thin positive margin
PS revenue is not subscription revenue and a buyer will not pay a software multiple for it. Its Cost of Revenue is the loaded cost of the people who configure your product for the customer: implementation engineers, solution consultants, their contractors, their travel. The CloudZero COGS models peg healthy PS at roughly break-even to a 5% margin — you run it to make the software stick, not to profit. A deeply negative PS margin is the most useful diagnostic on the page, because it isn't really a services problem. It means your product is too hard to deploy and you're subsidizing the gap with implementation labor. When PS climbs past 15% of total revenue, your blended COGS is structurally higher and your "software" company is partly a services company — which is exactly the reclassification a buyer is hoping to make.
Clean it yourself, on your terms
The worst time to learn your real gross margin is in week three of a Quality of Earnings review, when someone else's accountants rebuild your P&L and present the corrected number to your buyer as a finding. At that point you're not defending a margin, you're defending your credibility — and every other number in your model now gets a second look. Do the work first. Three moves, in order:
Split revenue before you split costs. Put Subscription Revenue and Professional Services Revenue on separate lines, each with its own Cost of Revenue directly beneath it. This is the single most valuable presentation change you can make, because it lets a buyer see the genuinely high-margin recurring software business standing on its own, instead of dragging the whole blended number down with implementation labor. You stop being penalized for the services you had to build to land enterprise customers.
Allocate your hero engineers honestly. If your Tier 3 developer spends 30% of the week on custom migrations and client-specific deployment bugs, 30% of that salary is Cost of Revenue, not R&D. Founders hate this one because it moves their best people into the "cost of delivery" bucket and makes the product look needier. But pretending deployment labor is product development is a red flag a diligence team will circle in the first week — and do not assume it gets handed back as a friendly EBITDA add-back. Recurring deployment work is a recurring cost; buyers treat it as such. The discipline is consistent with how OPEXEngine frames shared-resource allocation for top-quartile benchmarking: split by where the hours actually go, every period, not by where it's flattering.
Get to per-tenant cost. The flat-rate, never-look-at-the-AWS-bill era is over. Tag your infrastructure spend by tenant so you can state the gross margin of your largest enterprise account versus your median mid-market one. If you can't, you don't know your unit economics — you know your average, which hides the whale that's eating 40% of your compute at a flat price. This Monday: pull last quarter's general ledger, tag every line in support, CS, implementation, and infra as COR or OpEx, and re-run the gross margin. If the number that comes out starts with a 7, you're early to the conversation a buyer was going to start anyway — and you control the framing instead of reacting to it.