The practical answer
- Short answer
- Your QofE has a number for everything except the code. Here's how to convert technical debt into a hard dollar figure your IC memo can actually use.
- Best fit
- Industry: B2B Tech. Function: Engineering
- Operating path
- Technical Debt → Turnaround & Restructuring → Transaction Advisory Services
- Key metric
- 33% Of avg. developer time is wasted on maintenance and tech debt (Stripe)
The one line item your QofE never priced
Picture the diligence binder on your desk. Working capital normalized to the dollar. Revenue cohorts cut six ways. A churn waterfall, a contract-by-contract NRR build, an add-back schedule arguing over whether the founder's boat counts as a business expense. Forty pages of financial rigor.
Then there's the technology section. Two paragraphs from a third-party advisor. "Modern stack. Some legacy components. Recommend further review post-close." That's it. The single largest off-balance-sheet liability in a software business — the thing that determines whether your value-creation plan happens in 18 months or 48 — gets a shrug and a hedge.
Here's the asymmetry that should bother you: a quality-of-earnings analyst will spend two days litigating a $40,000 expense reclassification, and then wave through a codebase that's quietly burning seven figures a year, because nobody framed it as money. The number exists. It's just sitting in your engineers' calendars instead of your model.
The translation is more direct than people assume. Stripe's Developer Coefficient report found that developers lose roughly a third of their week to maintenance and dealing with bad code. That's not an abstraction about "engineering culture." On a $9M engineering payroll, a third of the team's time is $3M of fully-loaded comp that produced no new product. You'd never approve a $3M annual line item labeled "treading water." You're approving it right now — you just can't see it, because it's denominated in story points instead of dollars.
A quality-of-earnings report will fight you over a $40,000 expense reclassification, then sign off on a codebase burning a million dollars a year because nobody asked the engineering team the right question. That asymmetry is where deals go to die.
A worked deal: pricing the debt on a $40M ARR target
Let me run an illustrative target so the method is concrete — say a $40M ARR vertical SaaS company, 60 engineers, the kind of asset that looks clean in the data room. Three numbers turn "the code is messy" into something your investment committee can underwrite.
Number one: the annual burn (what the debt costs you every year you hold it)
Pull the actual capacity split. Ask the VP of Engineering for the last two quarters of ticket data broken into new feature work versus unplanned work — bugs, incidents, "why did this break again." A healthy team spends maybe 15-20% keeping the lights on. Distressed assets routinely run 40-50%.
If those 60 engineers cost $160K loaded and 45% of their time goes to maintenance, the math is 60 × $160K × (45% − 18% baseline) = roughly $2.6M per year in excess burn. That's not a one-time hit. It recurs every single year of your hold, and it scales up as you push the team to ship faster. This is your interest payment, and you're paying it whether or not you've named it.
Number two: the remediation check (what it costs to make the asset transferable)
This is capital, not opex, and it has a ceiling you need to find before you sign. The mistake is pricing "good code." Price transferable code — the minimum to make the asset something the next buyer's diligence won't flag. Identify the modules that protect revenue (the billing engine, the auth layer, the core data model) and scope the hours to stabilize only those. CISQ pegged the cost of poor software quality in the U.S. at $2.41 trillion — a useful gut-check on scale, but your number comes from your asset, not the macro. If stabilizing the billing system that touches 80% of revenue is a $1.8M project, that's a CapEx line in your 100-day plan, not a surprise in month nine.
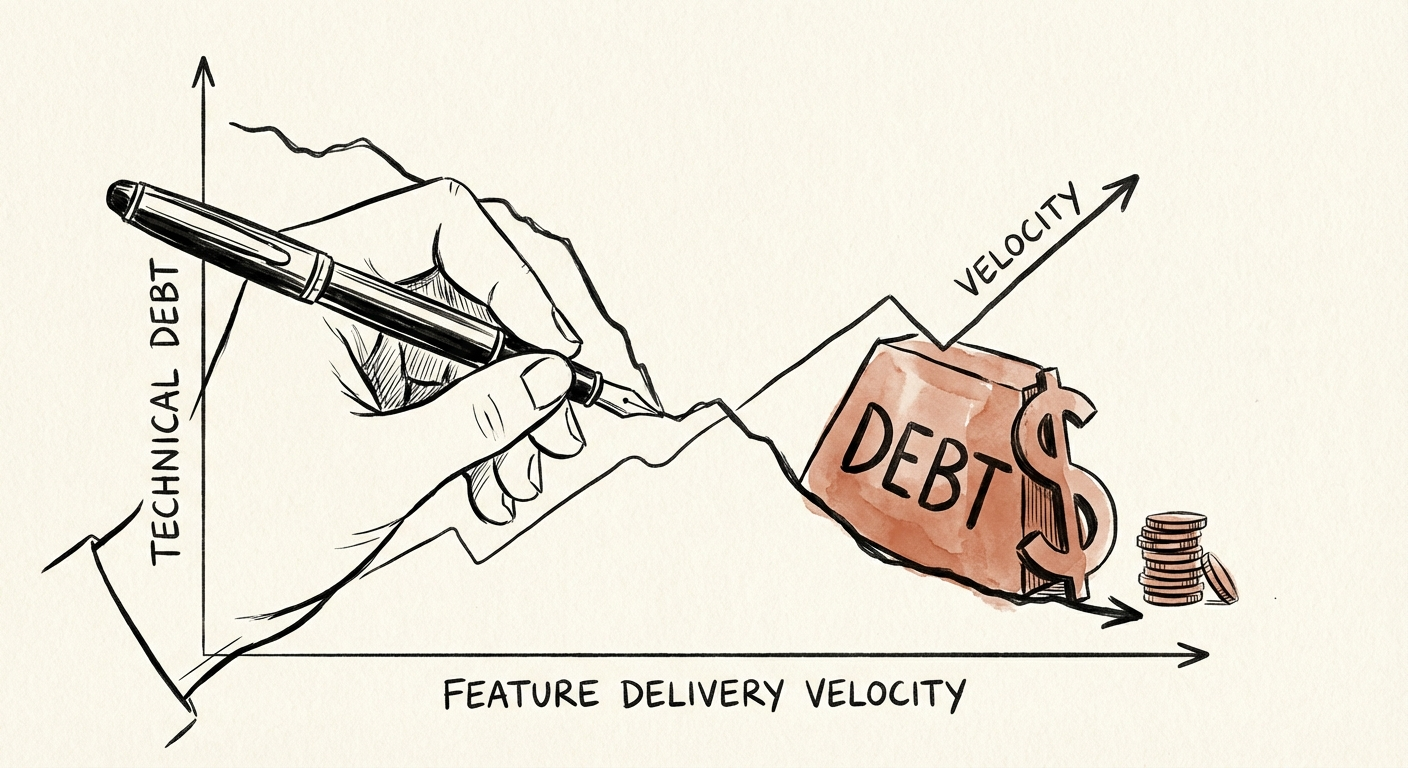
Number three: the velocity gap (what the debt costs you in growth you'll never book)
This is the one that moves the multiple. McKinsey's Developer Velocity Index work found top-quartile teams grow revenue several times faster than the laggards. Translate it to your roadmap: if a competitor ships a new integration in three weeks and your target needs four months because every change ripples through a monolith, you're not buying a growth story — you're buying a company that can't execute the growth story in the CIM. Put a number on the delayed feature revenue. That gap is usually larger than the burn and the remediation combined, and it's the part your seller's banker is counting on you not to price.
What you do with the number on Monday
Once you've got the three figures — call it $2.6M annual burn, $1.8M remediation, plus a quantified velocity gap — you stop arguing about engineering and start making a capital decision. There are only three live options, and the number tells you which one.
Re-trade. If the remediation check is large and the seller's model assumes growth the codebase can't physically deliver, that's a price conversation, not a punt to post-close. A funded, scoped tech-debt CapEx line is a legitimate basis to adjust — the same way a deferred maintenance schedule re-prices a building.
Underwrite it as a value-creation lever. If the burn is the dominant number, you've found margin. Knock maintenance from 45% down toward 20% over the hold and that $2.6M flows to EBITDA — a real add-back at exit, not a hopeful one. The path is a Strangler Fig migration, never a rewrite: ring-fence the 20% of files generating 80% of the incidents, freeze new features on them, build the new work as clean services calling the old system through an API, and retire the legacy piece module by module. Total rewrites are where hold periods go to die.
Walk. Sometimes the velocity gap is structural and the asset simply cannot run the play you bought it for. Knowing that before you wire funds is worth more than any add-back.
For your next deal, make this non-negotiable: a one-page Tech Debt P&L in the diligence pack, refreshed in the first board deck — maintenance ratio with a trend line, count of critical-severity issues, and quarter-over-quarter delivery velocity. Three numbers. They turn the vaguest section of your binder into the one you can actually defend in committee. You speak fluent EBITDA already. It's time the technology section did too.