The practical answer
- Short answer
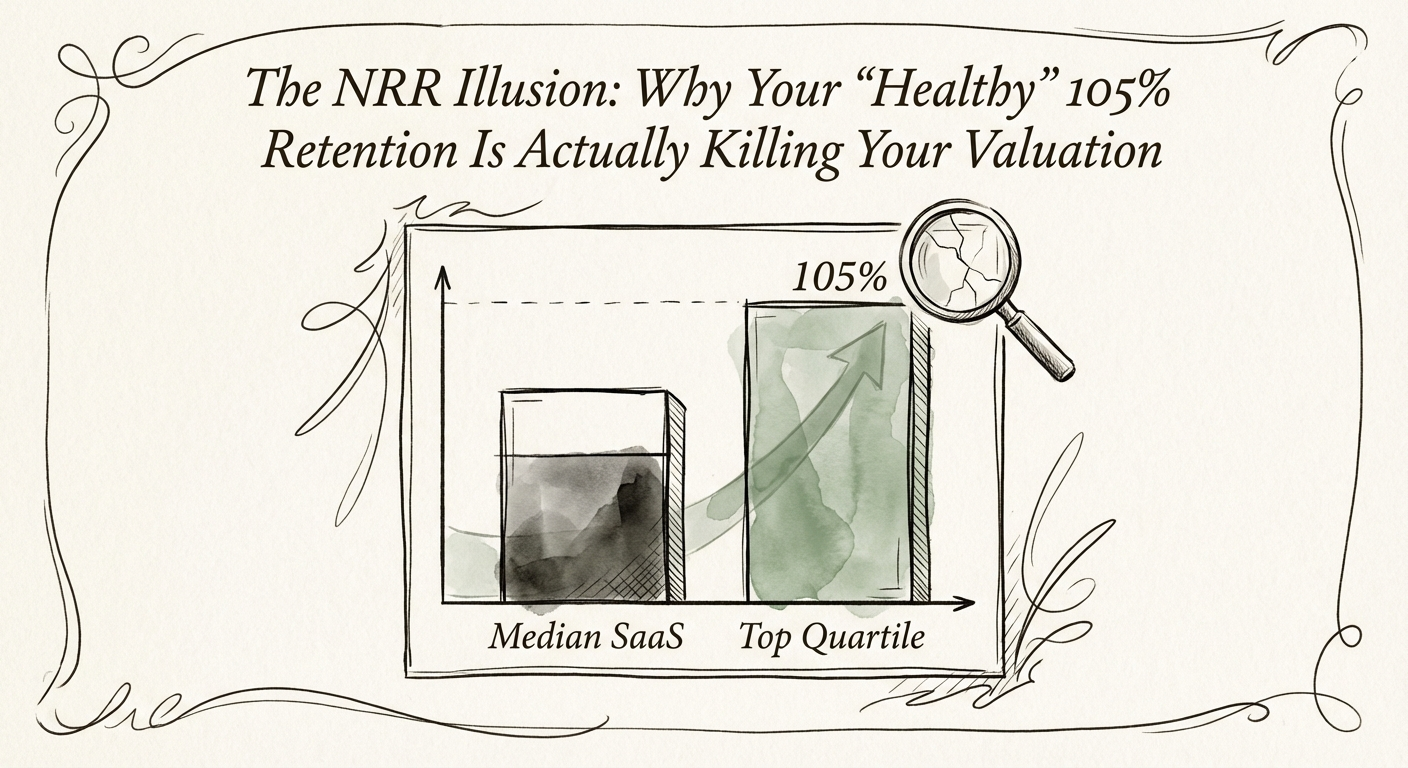
- A 105% NRR can sit on top of 85% gross retention — you're churning logos and upselling the survivors. Here's the 3-step audit to run before your next raise.
- Best fit
- Industry: B2B SaaS. Function: Customer Success
- Operating path
- Revenue Architecture → Commercial Performance → Office of the CFO
- Key metric
- 106% Median NRR for B2B SaaS in 2025 (Wudpecker/SaaS Capital)
One number, two jobs, and a board that only ever sees the flattering one
Net Revenue Retention is a blended figure. It rolls expansion, contraction, and churn into a single percentage and hands it to the board as a verdict on customer health. The problem with any blended number is that it can stay green while one of its inputs quietly turns red. NRR is the metric most likely to do exactly that — and at Series B and C, it does it constantly.
Here is the arithmetic that should make you nervous. Picture a company opening the year with $10M in ARR. Over the next twelve months it expands $2M from its best accounts and loses $1.5M to logos that don't renew. Net change: up $0.5M. NRR reports a comfortable 105%. But gross revenue retention — what survives before a single upsell dollar — is 85%. The same number that earned applause is sitting directly on top of a fifteen-point leak.
The danger isn't the leak itself. It's that NRR is engineered to camouflage it. As long as your largest, most embedded accounts keep buying more seats, their expansion can absorb the disappearance of a dozen mid-market logos and the headline never flinches. You're not retaining a base. You're extracting more cash from the accounts that happened to survive, and calling the result growth.
This is survivorship bias wearing a finance hat. The 105% reflects the customers still in the room. It says nothing about the ones who left — and at Series B/C, the ones leaving are usually telling you something specific: that the product fits a narrow segment beautifully and the rest of your signed logos poorly. The median NRR for B2B SaaS in 2025 has settled at 106%, so 105% isn't even a strong showing. It's the metric you'd expect from a company papering over a problem it can't see.
Worth reading alongside this: NRR Below 100%? Your Customer Success Function Is Underwater.
NRR is one number doing two jobs. Split it, and you usually find a CS team being paid to upsell whales while the mid-market quietly walks out the back door.
What a diligence team actually does with your retention numbers
When you raise a Series C, the difference between NRR and GRR stops being an internal nuance and becomes the first thing a sharp diligence analyst pulls apart. They will not take your blended 105% at face value. They will rebuild it from a cohort table and look at three things in this order.
Gross retention, naked. The 2025 median GRR for private B2B SaaS lands around 90%. If yours is in the 80s, you are rebuilding a meaningful slice of the company every year just to stand still — and the analyst knows that a base losing 15% gross is structurally fragile no matter how good the expansion story looks. Top-quartile operators commanding premium multiples pair 120%+ NRR with gross retention in the mid-90s. That pairing is the tell. NRR alone is not.
Where the expansion comes from. If your 105% is carried by two or three whale accounts compounding seats, that's concentration risk dressed as momentum. Lose one of them and the headline collapses overnight — not over a smooth quarter, but the moment a renewal slips. ICONIQ Growth's 2025 read of the software market reinforces what the buyers already price in: durable expansion is broad-based, not balanced on a handful of logos.
What retention costs you to produce. Median spend on Customer Success and support sits near 8% of ARR. If you're burning 12–15% of ARR to hold a GRR in the 80s, you don't have a people problem — you have a product problem wearing a CS team as a bandage. And the workload data exposes the usual excuse. The "we're high-touch" defense rarely survives contact with the numbers: efficient enterprise CSMs carry $2–5M ARR across 10–50 accounts, mid-market CSMs run 50–70, tech-touch CSMs handle 100+ through automation. A CSM drowning at 20 accounts isn't a capacity problem. It's a process and tooling gap that diligence will read as future opex.
For the staffing side of this, see Customer Success Team Size Benchmarks: Why You're Likely Overstaffed.
The 90-minute audit that splits real retention from theater
You don't need a new dashboard to find your real number. You need to stop looking at the blended one. Block ninety minutes this week and run these three cuts.
1. Pull logo retention by cohort, in counts, not dollars. Take the customers you signed in a given year and ask how many are still here. If you signed 100 logos in a cohort and 78 remain, that's the truth NRR is hiding — high logo churn underneath healthy dollar retention is the textbook signature of a product that's excellent for one segment and oversold to the rest. The dollars can lie. The logo count can't.
2. Audit your last ten saves and ask what actually saved them. For each renewal you "rescued," write down why it stayed. Did the product become essential, or did a CSM spend forty hours manually cleaning data, re-running onboarding, and quietly trading a discount for the signature? Retention built on heroics is not retention — it's a services cost wearing SaaS margins. Durable retention is boring; it renews because the product is load-bearing, not because someone fought for it. Count how many of your ten were boring. That ratio is your real health score.
3. Rewrite the CS team's primary KPI. If the team is measured on upsell dollars, you've paid them to inflate NRR while logo churn keeps draining the base underneath. Move the headline metric to gross revenue retention and force value realization on the existing base before anyone is allowed to ask for more money. This will feel like a downgrade — topline growth may soften for a quarter or two as you stop masking churn with aggressive expansion. That's the cost of building a base that survives diligence instead of decorating a slide. The destination is the top-quartile pairing: chase 120% NRR, but only once it sits on a floor of 90%+ gross.
We work through the multiple math behind that pairing in The Valuation Multiplier. The short version for Monday: stop celebrating the 105%, and go find the 85% before someone with a checkbook finds it first.