The practical answer
- Short answer
- Benchmarks for M&A integration budgets: Why the standard 3% fails. Data shows real integration costs average 1.2x annual synergies or 5-10% of deal value.
- Best fit
- Industry: Private Equity / Tech. Function: Operations & Finance
- Operating path
- Migration & Integration → Turnaround & Restructuring → Transaction Advisory Services
- Key metric
- 1.2x One-time cost required to capture $1 of annualized synergy
The "Transaction Fee" Fallacy in Private Equity
If you are an Operating Partner managing a fresh acquisition, you have likely seen the deal model. It is precise, optimistic, and heavily focused on the purchase price multiple. But look at the line item for "Integration & Restructuring." If it sits at 1% to 3% of the deal value—mirroring what you paid the investment bankers—you have already lost the first year of value creation.
There is a pervasive myth in the lower middle market that integration is simply a matter of "plugging in" the new asset. This leads to the Transaction Fee Fallacy: the belief that integration is an administrative cost similar to legal or advisory fees. In reality, integration is an operational overhaul. When you budget 2% for integration on a $100M acquisition ($2M), but the thesis relies on capturing $5M in EBITDA synergies, you are mathematically set up to fail.
The cost to extract value is rising. Data from 2024-2025 indicates that for complex "buy-and-build" or turnaround plays—the bread and butter of firms like yours—the actual cost to achieve operational independence and synergy realization is significantly higher than historical norms. If you underfund the Integration Management Office (IMO) and IT migration, you don't save money. You simply pay it later in the form of phantom synergies and prolonged margin erosion.
If you budget 1% for integration, you are budgeting for a press release, not a merged company. Real synergy capture costs $1.20 for every dollar saved.
The Real Benchmarks: What to Actually Allocate
Stop guessing and start using the "Synergy Capture Ratio." Leading data from McKinsey and EY suggests a far more capital-intensive reality for successful integrations than the standard spreadsheet allows.
Benchmark 1: The Synergy Capture Ratio (1.2x)
The most accurate way to budget isn't by deal size, but by synergy target. The Golden Rule is 1.2x. For every $1 of annualized run-rate synergy you plan to capture, you must budget $1.20 in one-time costs to get there.
- Scenario: You want $5M in cost synergies (headcount reduction, vendor consolidation, tool rationalization).
- The Budget: You need a $6M one-time integration budget.
- The Reality: Most firms budget $2M, hit a wall at month 6, and leave $3M of annual EBITDA on the table.
Benchmark 2: Percentage of Deal Value (5-10%)
While the general market average hovers around 3-4%, this includes massive corporate mergers where fixed costs are diluted. For mid-market PE deals ($50M - $500M EV), particularly in the tech and services sectors, the effective integration cost is often 5% to 10% of deal value. A study by EY found that in complex transformations, companies reported spending as much as 14% of total deal value to fully integrate and realize value.
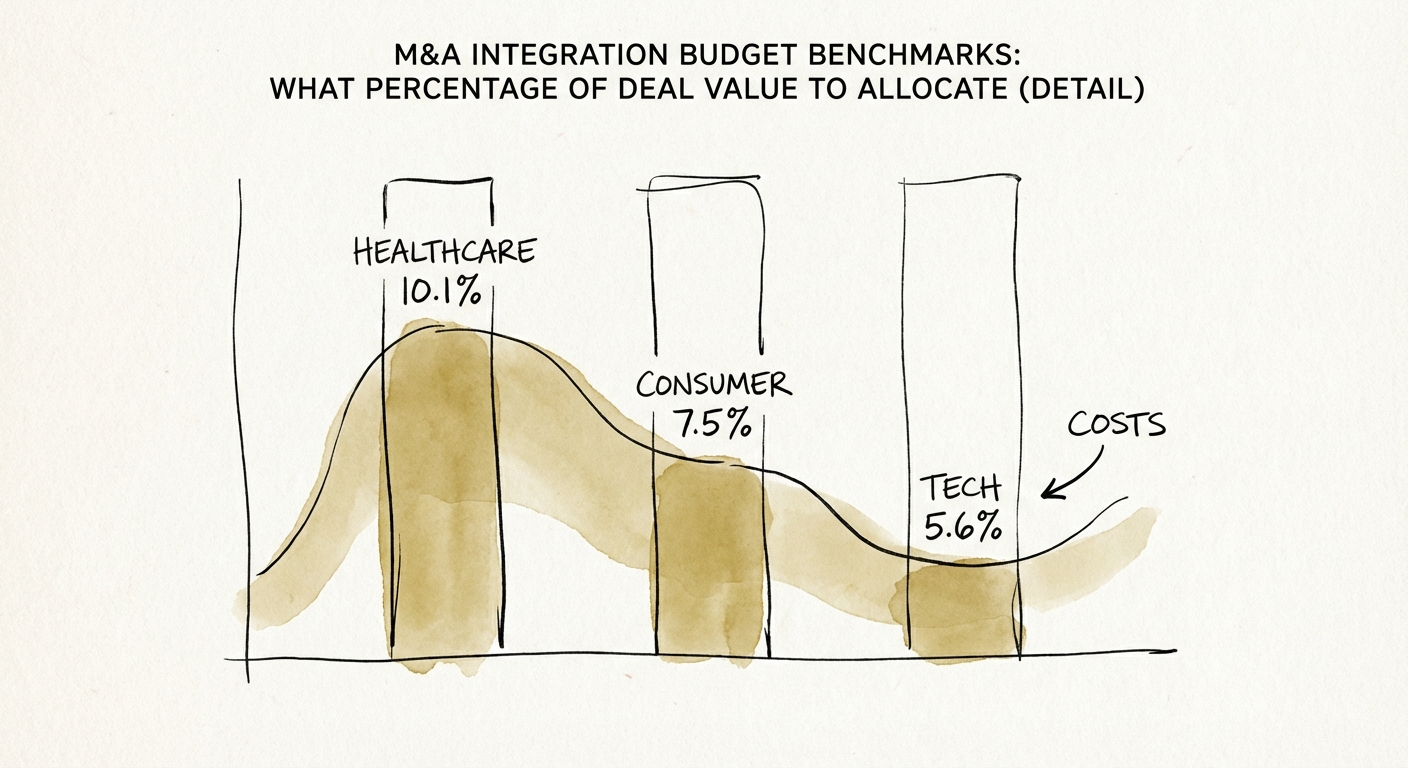
Benchmark 3: Percentage of Target Revenue by Sector
If you prefer revenue-based benchmarking, sector nuance is critical. Integration costs in highly regulated or technical industries explode due to compliance and data migration needs.
- Healthcare & Life Sciences: Median integration cost is 10.1% of target revenue (due to regulatory compliance).
- Technology & Software: Median cost is 5.6% of target revenue (driven by cloud migration and talent retention).
- Consumer Products: Median cost is 7.5% of target revenue.
The "Must-Fund" Buckets for PE Operating Partners
You cannot effectively allocate capital if you don't know where the money burns. In a typical mid-market integration, 50% of your budget will vanish into severance and retention. That leaves very little for the actual work of systems integration unless you plan for it.
1. The IT & Data Reality Check
IT integration is almost always the source of the blowout. While you may budget for license consolidation, you likely missed the "Data Gravity" tax. Moving 20TB of messy historical data from a legacy ERP to your platform standard isn't a weekend script; it's a six-month project. Allocate at least 25% of your total integration budget specifically to IT and systems unification. If you don't, you will end up running two ERPs for three years, destroying your G&A synergy thesis.
2. The IMO is Not "Part-Time"
The biggest mistake Operating Partners make is assigning the integration leadership to a busy CFO or VP of Ops as a "stretch project." Successful integration requires a funded IMO. This costs money—typically 8-12% of the integration budget goes to external support, interim leadership, or dedicated project management. This is not overhead; it is insurance.
Conclusion: Buy the Result, Not the Savings
When you present the integration budget to the Investment Committee, do not frame it as a cost. Frame it as the purchase price of the EBITDA expansion. If the deal model promises a 4x return on invested capital, that return is contingent on the integration succeeding. spending 1.2x one-time to secure a perpetual 1.0x EBITDA lift is the best ROI in the entire portfolio. Don't value-engineer the bridge that gets you there.