The practical answer
- Short answer
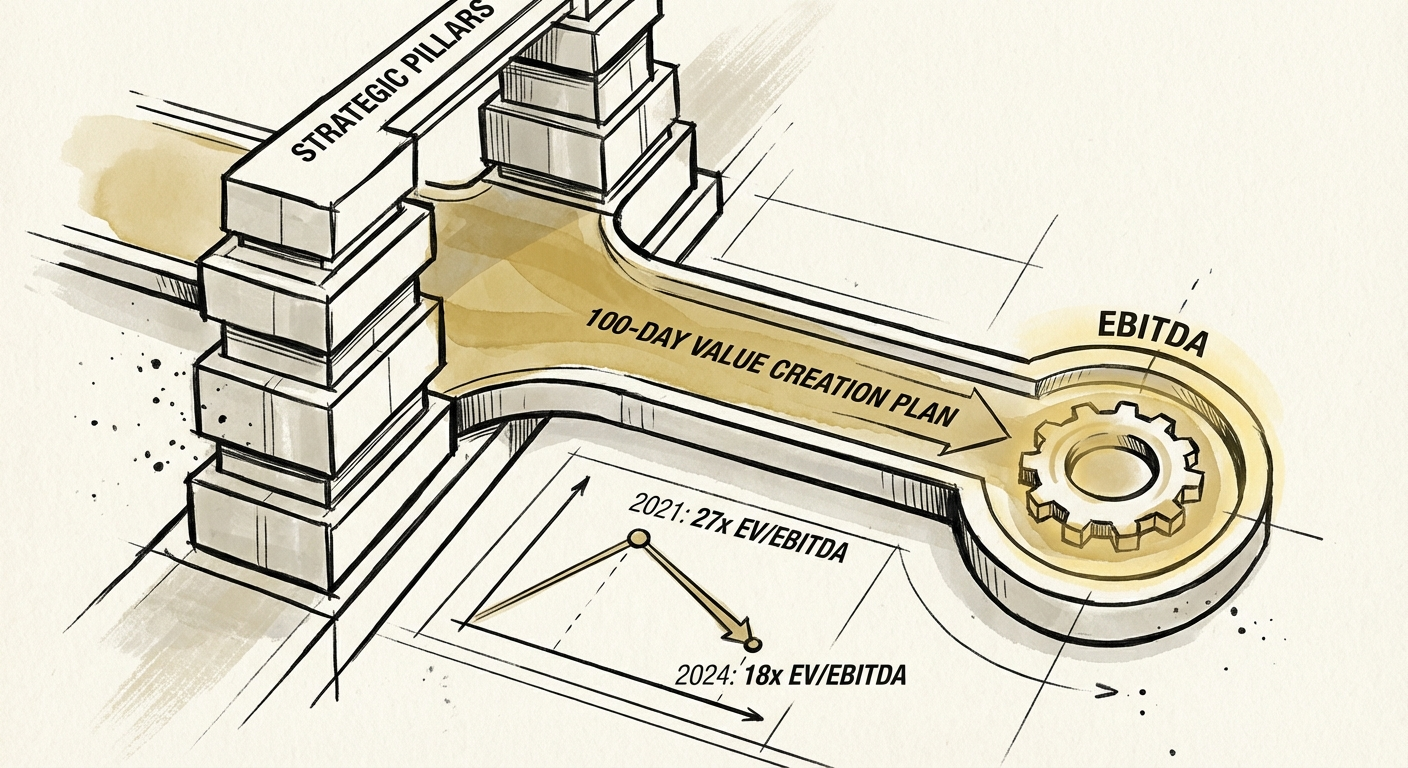
- Multiples compressed 27x to 18x. Holds stretched to 6.7 years. A 100-day plan built for operators who have to manufacture the markup, sprint by sprint.
- Best fit
- Industry: PE / Tech Services. Function: Operations
- Operating path
- Exit Readiness → Operational Excellence → Transaction Advisory Services
- Key metric
- 7.8 Mo Time to Pricing Impact
The deal that taught me what 100 days is actually for
A sponsor I talked to last year closed a tech-services platform at a number that made sense in 2021. By the time it cleared, the comps had moved underneath them. The entry was fine. The exit math was not, and no amount of "strategic alignment" was going to close the gap. They had bought a 12x entry into an 18x world and needed the company itself to do the lifting that the market used to do for free.
That is the whole story of this cycle in one sentence. According to KPMG's 2025 Global PE Value Creation Survey, global EV/EBITDA multiples compressed from 27x in 2021 to 18x in 2024. Meanwhile Bain's 2025 report shows median hold periods stretching to 6.7 years, the longest in nearly two decades. Both numbers point the same direction: the return has to come from the operating account now, not the resale.
Here is what most operating partners get wrong in the first hundred days. They treat the window as an orientation. The advisors build an 80-page deck, the management team gives the tour, and "Phase 1: Discovery" eats six weeks. By the time the plan is "ready," the asset has burned a quarter of its cheapest, most cooperative time. The first hundred days is the only stretch where a new owner has full permission to break things and a management team that has not yet learned how to manage you. Spend it learning and you have spent your leverage.
And the diligence you relied on is leakier than the binder suggests. Roughly a quarter of deals now surface material issues that never showed up in the data room. A 100-day plan that is rigid snaps the first time one of those surfaces. A plan that is purely financial walks right past the operational leak that is actually draining the margin. You need one that reads a P&L and reads an engineering backlog with equal fluency, because the cash is hiding in both.
For a decade the market handed you the markup. Now you have to build it by hand, in the first hundred days, before the management team learns to manage you.
Sequence the levers by how fast they hit the P&L
Throw out the Gantt chart. Order the hundred days by time-to-cash, fastest first, so the early wins fund the slower structural work. Three sprints.
Days 0-30: Find the price you are leaving on the table
Month one is not a listening tour. It is a hunt for the fastest reliable EBITDA lift, and across McKinsey's value-creation data that lever is pricing. It is the most dependable move on the board and the one operators most consistently delay. The catch is timing: meaningful pricing impact takes roughly 7.8 months to flow through. If you start it on Day 60 it lands after the window that matters most, so it has to be a Day 1 action.
- Profit, not bookings. Re-segment the customer base by gross margin instead of revenue. In nearly every services portfolio there is a bottom slice of accounts consuming half the support load while throwing off almost no margin. A revenue-quality audit finds them in week one, and the answer is usually a re-price or a managed exit, not a save.
- The legacy-contract catch-up. CPI escalators that were never enforced, multi-year deals signed at a discount nobody remembers approving. A point of price drops most of itself to the bottom line in a services model. That recovery is what bankrolls the rest of the plan.
- Cash control tower. If the 13-week forecast wobbles, no PO over $5K moves without CFO sign-off, starting this week. You are buying runway for the structural work in sprint two.
Days 31-60: Fix what diligence missed
With the bleeding stopped, go after the structural rot — almost always buried in delivery and engineering, where the data room never looked.
- The keep-the-lights-on tax. If most engineering hours are going to maintenance and firefighting, the product roadmap is fiction. Quantify it. A team spending 70% of its time staying alive is not building the velocity story you will eventually need to sell.
- Utilization reset. Services utilization quietly drifts into the sub-69% danger band. Tighten time tracking and cut the bench before it becomes the culture.
- Forecast discipline. Stand up a weekly forecast call that actually holds reps to their number, and kill the 3x-coverage comfort blanket. Manage the slice of pipeline that is real, not the slide that flatters the board.
Days 61-90: Grade the team you inherited
By month three you know which leaders run toward a fire and which ones narrate it. Now you act. A 2026 value-creation plan cannot run on a 2019 bench: if the head of sales cannot walk you through the funnel math, or the CTO cannot explain the cloud bill, the plan has already named your first two hires. And start documenting the cash-to-cash cycle now — tribal knowledge is the single quietest valuation killer in a services company, and the data room you build for the exit starts with these notes.
The hundred days fails in the drift, so govern against it
Plans rarely die on Day 90. They die in the gap between what the deck says and what the standups actually track. The deck says "margin expansion"; the daily rhythm quietly reverts to shipping the next feature and chasing the next logo. What you measure every week is what the company becomes.
So replace the backward-looking monthly board pack with a one-page weekly flash report, out every Friday at noon, covering three things and nothing else: liquidity (cash, weekly burn, collections), sales velocity (new pipeline, slipped deals, forecast accuracy), and operational health (billable utilization, ticket backlog, critical outages). Hold one rule. Red for two weeks, you intervene. Red for four, you change the person who owns the number. That cadence is what converts a hundred-day plan from a document into an operating reflex.
And keep the exit in frame the entire time, because the market gives you no room to be sloppy. Bain puts the global stockpile of unsold assets in the trillions, which means a buyer in this cycle is not paying a premium for "growing." They are paying for clean — a data room that tells a story of systematic, repeatable performance instead of founder heroics nobody can reproduce. That is the difference between manufacturing the markup the market used to hand you and holding the asset for the full 6.7 years because you treated the first hundred days as onboarding.
Pick the three numbers your flash report will track and the one pricing move you can start Monday. If you want a second set of operator eyes on the sequence — which lever first, which exec is a hire — that is the conversation we have before the plan goes to the deal team.