
The practical answer
- Short answer
- Stop the 80-page vanity metrics. Here is the 15-slide board deck template that Private Equity Operating Partners actually want to see in 2026.
- Best fit
- Industry: Private Equity. Function: Office of the CFO
- Operating path
- Financial Infrastructure → Commercial Performance → Valuations
- Key metric
- 21% More time PE boards spend on strategy vs. public boards (McKinsey 2025).
The Diagnosis: Why Your 80-Page Deck is Killing Your Valuation
If your board deck has an appendix larger than your operating agreement, you have a problem. I’ve sat in hundreds of PE board meetings, and the pattern is painfully consistent: the thickness of the board deck is inversely proportional to the clarity of the strategy.
Most Series B and C founders treat board meetings as a show-and-tell defense mechanism. They pack 80 pages with vanity metrics—cumulative signups, social media impressions, "meetings booked"—hoping that volume will mask the fact that EBITDA missed by 12% and the new product launch is three months late.
For a PE Operating Partner, this isn't just annoying; it's a red flag. It screams that the management team doesn't know what actually drives value. In 2025, the tolerance for this "performance theater" has hit zero. With hold periods stretching to 5.9 years and the cost of capital remaining stubborn, we don't have time for a three-hour read-out of the news. We need to know if the asset is appreciating or depreciating.
The "Vanity Metric" Trap
The most dangerous slide in any deck is the one with the "hockey stick" cumulative chart that never goes down. It tells us nothing about the health of the business today. PE sponsors trade on predictability and margin expansion. If your deck focuses on activities (what you did) rather than outcomes (what you achieved), you are failing the governance test.
Recent data from McKinsey highlights this gap: PE-backed boards spend 21% more time on strategy than their public company counterparts. If your deck forces the board to spend 90 minutes correcting your definition of "Gross Margin" or asking why cash flow doesn't match the bookings report, you have stolen that strategic time from yourself.
The thickness of the board deck is inversely proportional to the clarity of the strategy. If you can't explain your variance in 15 slides, you don't understand your business.
The Architecture: The 15-Slide Standard
The goal of a PE board deck is not to inform; it is to align. The information should have been sent 72 hours in advance (non-negotiable). The meeting itself is for decision-making. Here is the structure that wins confidence.
Section 1: The Truth (Slides 1-3)
Slide 1: CEO Executive Summary & The "Ask"
Three bullets on high-lights, three on low-lights. Be brutally honest. If you missed a covenant, it goes here, in red, font size 24. End with "Key Decisions Required Today." If you don't ask for a decision, why are we meeting?
Slide 2: The Flash Dashboard
One page. Rows are metrics (Revenue, EBITDA, Cash, Bookings, Churn, CAC). Columns are: Actual vs. Budget (Month), Actual vs. Budget (YTD), and Forecast (EOY). Color-coded. No commentary. The numbers speak for themselves.
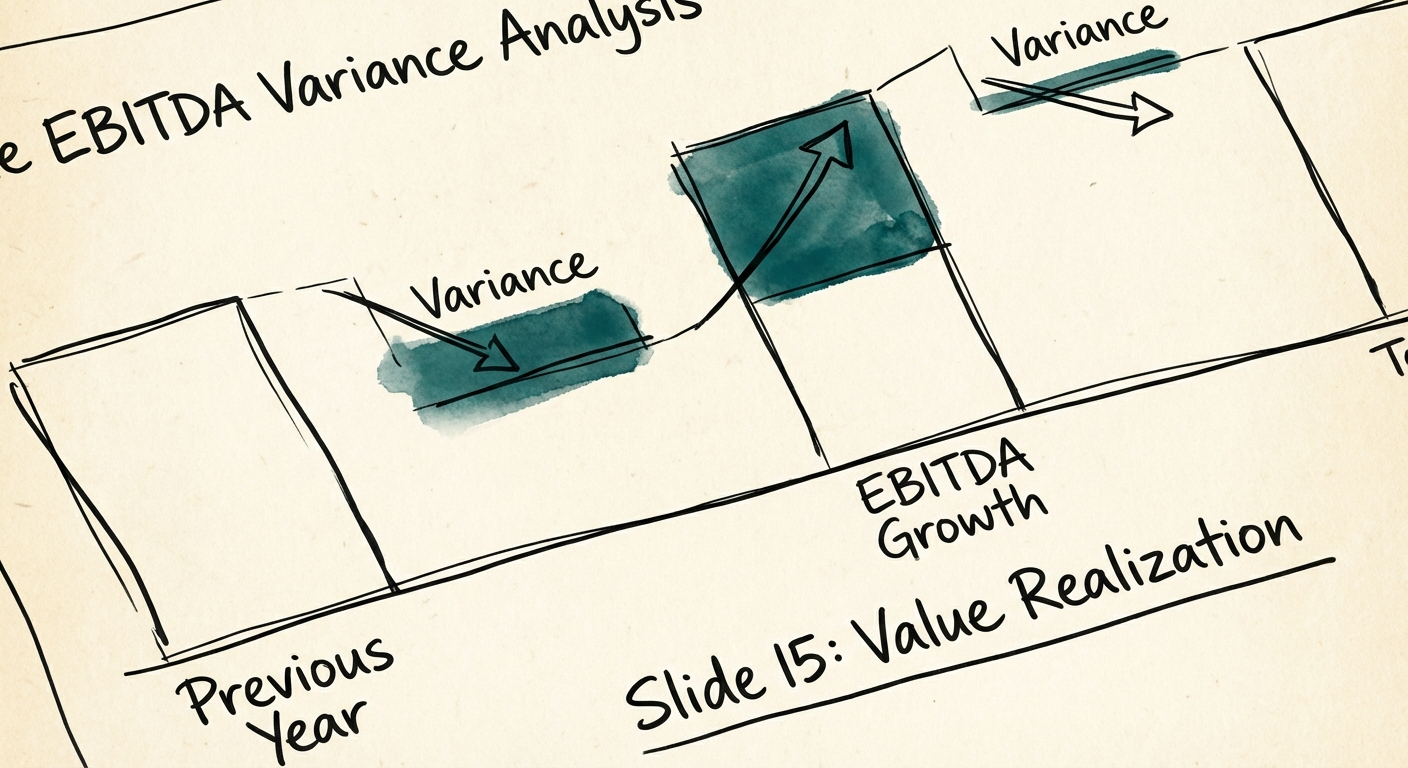
Slide 3: The Value Creation Bridge
This is what separates PE assets from VC experiments. Show a bridge chart explaining the variance in EBITDA. "We promised $2M. We delivered $1.5M. The $500k gap is composed of: -$200k sales miss, -$100k margin compression, -$200k hiring timing." This proves you understand the levers of your own P&L.
Section 2: The Engine (Slides 4-10)
Slide 4-5: Commercial Performance
Stop showing "pipeline value." Show weighted pipeline velocity and conversion rates. Segment by logo type. Track the KPIs that predict the future, not just the ones that record the past.
Slide 6-7: Operational & Technical Health
For tech-enabled services, this is critical. Uptime, ticket backlog, and—crucially—Gross Margin per Product Line. If you are shipping spaghetti code to hit a release date, I want to see the Technical Debt accrual here.
Slide 8: The People Plan
Bain's 2025 research indicates that 50-70% of portfolio CEOs are replaced during the hold period. Often, this is because they fail to build the team that gets them to the next stage. Show your org chart gaps. Who are we hiring? Who is underperforming? What is the Time-to-Fill on revenue-generating roles?
Section 3: The Deep Dive (Slides 11-15)
Pick one strategic topic per meeting. M&A targets, a pricing overhaul, or a major platform migration. Dedicate the rest of the deck to this. This is where the board earns its keep.
The Execution: Governance is a Competitive Advantage
A great deck sent late is a bad deck. The "72-Hour Rule" is absolute. If board members receive materials the night before, they are reading during the meeting. That turns a strategic session into a study hall.
The "Red" Rule
Founders often hide bad news in the appendix or camouflage it with "green" commentary. In a PE environment, bad news must travel faster than good news. If a metric is red, own it immediately. "We missed the forecast because of X. We have already taken action Y. We expect recovery by Z." That builds trust. Hiding it destroys trust instantly.
Stop Reporting, Start governing
Your board is not your teacher grading your homework. They are your co-investors. They want to know one thing: Are we on track for the exit multiple?
If you can't answer that in 15 slides, you don't understand your business well enough to sell it. Strip the fluff. Focus on the Value Creation Plan. If you need a template for the metrics that actually matter to a CFO, read our guide on the 10 metrics that stop the vanity show.
This isn't just about saving time. It's about saving your equity. When the board trusts your reporting, they meddle less and support more. When they doubt your numbers, they start asking for the raw data. And once they have the raw data, you are no longer the CEO; you are just the person entering it into the spreadsheet.